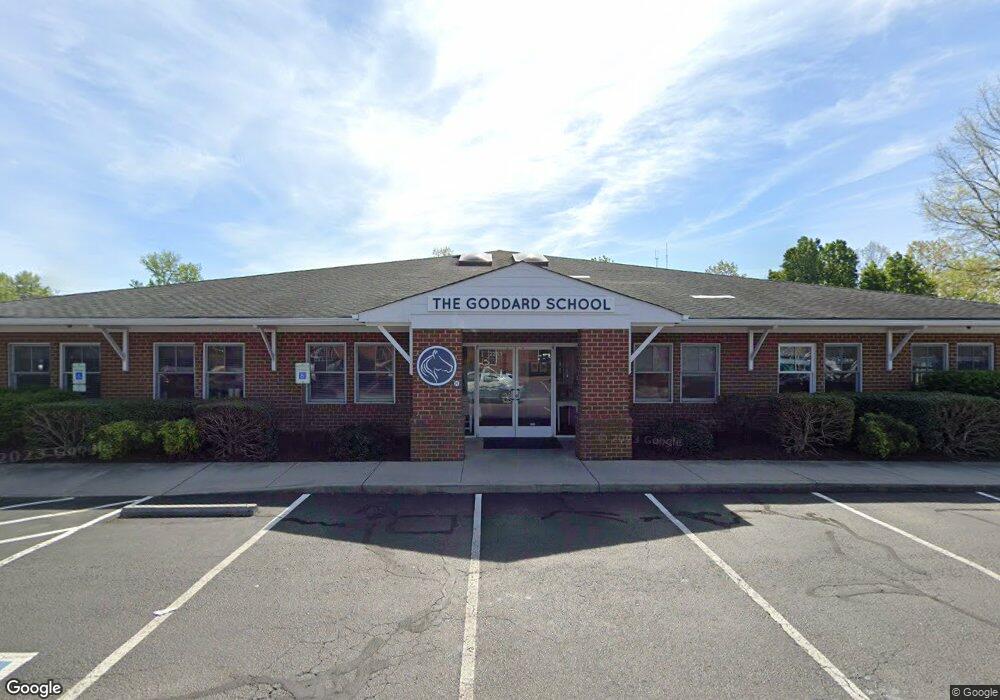
2361 Robious Station Cir Midlothian, VA 23113
Bon Air NeighborhoodEstimated Value: $2,676,320
--
Bed
--
Bath
7,675
Sq Ft
$349/Sq Ft
Est. Value
About This Home
This home is located at 2361 Robious Station Cir, Midlothian, VA 23113 and is currently priced at $2,676,320, approximately $348 per square foot. 2361 Robious Station Cir is a home located in Chesterfield County with nearby schools including Robious Elementary School, Robious Middle School, and James River High School.
Ownership History
Date
Name
Owned For
Owner Type
Purchase Details
Closed on
Dec 1, 2022
Sold by
Landsense Llc
Bought by
Stass Corp
Current Estimated Value
Home Financials for this Owner
Home Financials are based on the most recent Mortgage that was taken out on this home.
Original Mortgage
$3,129,000
Outstanding Balance
$2,986,877
Interest Rate
6.95%
Mortgage Type
New Conventional
Purchase Details
Closed on
Nov 18, 2005
Sold by
R J M Holdings L L C
Bought by
Landsense L L C
Home Financials for this Owner
Home Financials are based on the most recent Mortgage that was taken out on this home.
Original Mortgage
$1,246,200
Interest Rate
6.07%
Mortgage Type
Construction
Purchase Details
Closed on
May 17, 2002
Bought by
Rjm Holdin
Home Financials for this Owner
Home Financials are based on the most recent Mortgage that was taken out on this home.
Original Mortgage
$662,000
Interest Rate
7.15%
Mortgage Type
Commercial
Create a Home Valuation Report for This Property
The Home Valuation Report is an in-depth analysis detailing your home's value as well as a comparison with similar homes in the area
Home Values in the Area
Average Home Value in this Area
Purchase History
| Date | Buyer | Sale Price | Title Company |
|---|---|---|---|
| Stass Corp | $1,800,000 | Wfg National Title | |
| Landsense L L C | $1,550,000 | -- | |
| Rjm Holdin | -- | -- |
Source: Public Records
Mortgage History
| Date | Status | Borrower | Loan Amount |
|---|---|---|---|
| Open | Stass Corp | $3,129,000 | |
| Previous Owner | Landsense L L C | $1,246,200 | |
| Previous Owner | Rjm Holdin | $662,000 |
Source: Public Records
Tax History Compared to Growth
Tax History
| Year | Tax Paid | Tax Assessment Tax Assessment Total Assessment is a certain percentage of the fair market value that is determined by local assessors to be the total taxable value of land and additions on the property. | Land | Improvement |
|---|---|---|---|---|
| 2025 | $17,627 | $1,952,500 | $484,600 | $1,467,900 |
| 2024 | $17,627 | $1,902,800 | $484,600 | $1,418,200 |
| 2023 | $16,334 | $1,794,900 | $484,600 | $1,310,300 |
| 2022 | $14,834 | $1,612,400 | $329,500 | $1,282,900 |
| 2021 | $15,067 | $1,559,700 | $329,500 | $1,230,200 |
| 2020 | $14,817 | $1,559,700 | $329,500 | $1,230,200 |
| 2019 | $14,393 | $1,515,000 | $323,100 | $1,191,900 |
| 2018 | $14,332 | $1,508,600 | $323,100 | $1,185,500 |
| 2017 | $14,483 | $1,508,600 | $323,100 | $1,185,500 |
| 2016 | $13,402 | $1,396,000 | $323,100 | $1,072,900 |
| 2015 | $13,402 | $1,396,000 | $323,100 | $1,072,900 |
| 2014 | $12,859 | $1,339,500 | $323,100 | $1,016,400 |
Source: Public Records
Map
Nearby Homes
- 2008 Magnolia Grove Way
- 11602 E Briar Patch Dr
- 11627 E Briar Patch Dr
- 11709 S Briar Patch Dr
- 11753 N Briar Patch Dr
- 11714 S Briar Patch Dr
- 11814 N Briar Patch Dr
- 11601 Featherstone Ct
- 11904 W Briar Patch Dr
- 11913 W Briar Patch Dr
- 1660 Sandgate Rd
- 1516 Sandgate Rd
- 11617 Olde Coach Dr
- 2819 Live Oak Ln
- 11911 Kilrenny Rd
- 3010 Middlewood Rd
- 1221 Warminster Dr
- 1040 Black Heath Rd
- 12260 Haydon Place
- 12233 Haydon Place
- 2301 Robious Station Cir
- 2318 Robious Station Cir
- 2312 Robious Station Cir
- 2306 Robious Station Cir
- 2300 Robious Station Cir
- 2331 Robious Station Cir
- 2201 Magnolia Grove Way
- 11601 Robious Rd
- 2205 Magnolia Grove Way
- 2205 Magnolia Grove Way
- 2205 Magnolia Grove Way Unit 2205
- 2205 Magnolia Grove Way Unit 17
- 2152 Magnolia Grove Way
- 2152 Magnolia Grove Way Unit 2152
- 2152 Magnolia Grove Way Unit 31
- 2209 Magnolia Grove Way Unit 2209
- 2209 Magnolia Grove Way
- 2209 Magnolia Grove Way Unit PH5
- 2144 Magnolia Grove Way
- 2140 Magnolia Grove Way