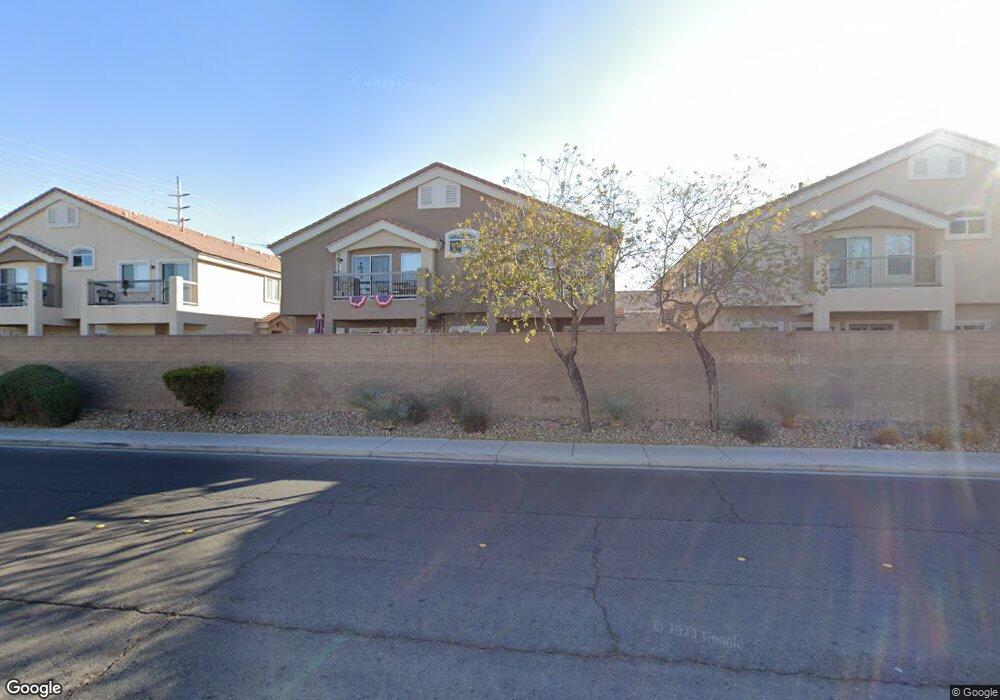
2362 Yellowstn Crk Dr Unit 101 Las Vegas, NV 89183
Silverado Ranch NeighborhoodEstimated Value: $307,000 - $321,000
2
Beds
2
Baths
1,189
Sq Ft
$264/Sq Ft
Est. Value
About This Home
This home is located at 2362 Yellowstn Crk Dr Unit 101, Las Vegas, NV 89183 and is currently estimated at $314,452, approximately $264 per square foot. 2362 Yellowstn Crk Dr Unit 101 is a home located in Clark County with nearby schools including Shirley A Barber Elementary, Charles Silvestri Junior High School, and Liberty High School.
Ownership History
Date
Name
Owned For
Owner Type
Purchase Details
Closed on
Aug 4, 2021
Sold by
Fukunaga Alvin and Fukunaga Martha
Bought by
Kea Valley Llc
Current Estimated Value
Purchase Details
Closed on
Mar 23, 2021
Sold by
Casa Anthony R
Bought by
Fukunaga Alvin and Fukunaga Martha
Home Financials for this Owner
Home Financials are based on the most recent Mortgage that was taken out on this home.
Original Mortgage
$169,400
Interest Rate
2.8%
Mortgage Type
New Conventional
Purchase Details
Closed on
Sep 27, 2007
Sold by
D R Horton Inc
Bought by
Casa Anthony R
Home Financials for this Owner
Home Financials are based on the most recent Mortgage that was taken out on this home.
Original Mortgage
$229,833
Interest Rate
6.61%
Mortgage Type
Unknown
Create a Home Valuation Report for This Property
The Home Valuation Report is an in-depth analysis detailing your home's value as well as a comparison with similar homes in the area
Home Values in the Area
Average Home Value in this Area
Purchase History
| Date | Buyer | Sale Price | Title Company |
|---|---|---|---|
| Kea Valley Llc | $242,000 | None Available | |
| Fukunaga Alvin | $242,000 | Ticor Title Henderson | |
| Casa Anthony R | $229,833 | Dhi Title |
Source: Public Records
Mortgage History
| Date | Status | Borrower | Loan Amount |
|---|---|---|---|
| Previous Owner | Fukunaga Alvin | $169,400 | |
| Previous Owner | Casa Anthony R | $229,833 |
Source: Public Records
Tax History Compared to Growth
Tax History
| Year | Tax Paid | Tax Assessment Tax Assessment Total Assessment is a certain percentage of the fair market value that is determined by local assessors to be the total taxable value of land and additions on the property. | Land | Improvement |
|---|---|---|---|---|
| 2025 | $1,703 | $79,304 | $27,650 | $51,654 |
| 2024 | $1,577 | $79,304 | $27,650 | $51,654 |
| 2023 | $1,577 | $74,363 | $27,650 | $46,713 |
| 2022 | $1,461 | $62,841 | $18,550 | $44,291 |
| 2021 | $1,353 | $53,529 | $17,500 | $36,029 |
| 2020 | $1,253 | $55,053 | $17,500 | $37,553 |
| 2019 | $1,174 | $54,646 | $17,500 | $37,146 |
| 2018 | $1,120 | $49,448 | $14,000 | $35,448 |
| 2017 | $1,366 | $46,148 | $11,200 | $34,948 |
| 2016 | $1,049 | $42,229 | $7,700 | $34,529 |
| 2015 | $1,046 | $40,718 | $7,000 | $33,718 |
| 2014 | $1,014 | $33,112 | $5,250 | $27,862 |
Source: Public Records
Map
Nearby Homes
- 9994 Government Point Way Unit 101
- 10062 Aspen Rose St Unit 103
- 2295 Koho Dr Unit 101
- 2013 Spiers Ave
- 9851 Silver Dew St
- 448 Temple Canyon Place
- 451 Rumford Place
- 10034 Candle Maker St
- 2300 E Silverado Ranch Blvd Unit 2112
- 2300 E Silverado Ranch Blvd Unit 2033
- 2300 E Silverado Ranch Blvd Unit 2161
- 2300 E Silverado Ranch Blvd Unit 1080
- 2300 E Silverado Ranch Blvd Unit 1106
- 2300 E Silverado Ranch Blvd Unit 2196
- 2300 E Silverado Ranch Blvd Unit 2158
- 2300 E Silverado Ranch Blvd Unit 1074
- 2300 E Silverado Ranch Blvd Unit 1180
- 2300 E Silverado Ranch Blvd Unit 1104
- 2300 E Silverado Ranch Blvd Unit 2133
- 2300 E Silverado Ranch Blvd Unit 2162
- 2362 Yellowstn Crk Dr Unit 103
- 2362 Yellowstn Crk Dr Unit 102
- 2362 Yellowstone Creek Dr Unit 103
- 2362 Yellowstone Creek Dr Unit 102
- 2362 Yellowstone Creek Dr Unit 101
- 2348 Yellowstone Creek Dr Unit 101
- 2348 Yellowstone Creek Dr Unit 103
- 2348 Yellowstone Creek Dr Unit 102 - 1
- 2348 Yellowstone Creek Dr Unit 102
- 2376 Yellowstn Crk Dr Unit 103
- 2376 Yellowstn Crk Dr Unit 102
- 2376 Yellowstn Crk Dr Unit 101
- 2376 Yellowstone Creek Dr Unit 103
- 2376 Yellowstone Creek Dr Unit 101
- 2348 Yellowstn Crk Dr Unit 102
- 2348 Yellowstn Crk Dr Unit 103
- 2348 Yellowstn Crk Dr Unit 101
- 2334 Yellowstone Creek Dr Unit 102
- 2334 Yellowstone Creek Dr Unit 103
- 2334 Yellowstone Creek Dr Unit 101