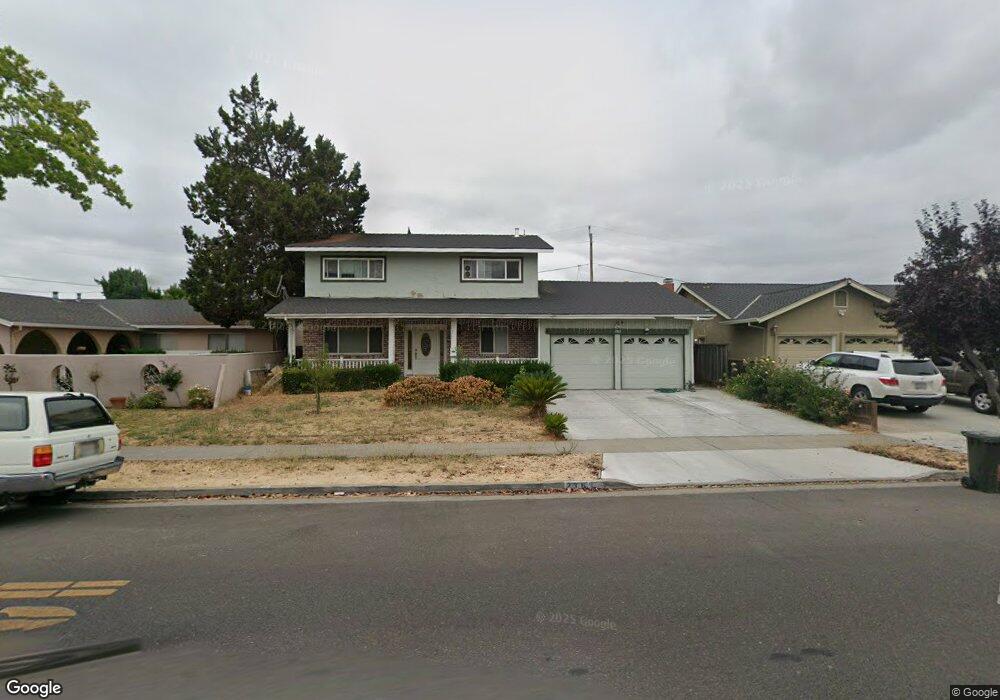
2363 Flint Ave San Jose, CA 95148
Mount Pleasant NeighborhoodEstimated Value: $1,414,000 - $1,558,000
4
Beds
3
Baths
2,125
Sq Ft
$704/Sq Ft
Est. Value
About This Home
This home is located at 2363 Flint Ave, San Jose, CA 95148 and is currently estimated at $1,495,506, approximately $703 per square foot. 2363 Flint Ave is a home located in Santa Clara County with nearby schools including Mt. Pleasant High School, Ida Jew Academies, and KIPP Navigate College Prep.
Ownership History
Date
Name
Owned For
Owner Type
Purchase Details
Closed on
Sep 7, 2021
Sold by
Dang Thang Huu and Nguyen Thao Thanh
Bought by
Dang Thang Huu and Nguyen Thao Thanh
Current Estimated Value
Home Financials for this Owner
Home Financials are based on the most recent Mortgage that was taken out on this home.
Original Mortgage
$340,000
Outstanding Balance
$259,524
Interest Rate
2.1%
Mortgage Type
New Conventional
Estimated Equity
$1,235,982
Purchase Details
Closed on
May 31, 2016
Sold by
Nguyen Maggie Q and Dang Thang Huu
Bought by
Dang Thang Huu and Nguyen Thao Thanh
Home Financials for this Owner
Home Financials are based on the most recent Mortgage that was taken out on this home.
Original Mortgage
$350,000
Interest Rate
3.61%
Mortgage Type
New Conventional
Purchase Details
Closed on
Aug 1, 2014
Sold by
Nguyen Maggie Q
Bought by
Nguyen Maggie Q and Dang Thang Huu
Purchase Details
Closed on
Feb 28, 2013
Sold by
Nguyen Maggie Q and Nguyen Maggie Giao
Bought by
Nguyen Maggie Q
Home Financials for this Owner
Home Financials are based on the most recent Mortgage that was taken out on this home.
Original Mortgage
$339,000
Interest Rate
3.4%
Mortgage Type
New Conventional
Purchase Details
Closed on
Feb 15, 2011
Sold by
Hong Lan Nguyen Family Trust
Bought by
Nguyen Maggie Giao
Home Financials for this Owner
Home Financials are based on the most recent Mortgage that was taken out on this home.
Original Mortgage
$348,000
Interest Rate
4.67%
Mortgage Type
New Conventional
Purchase Details
Closed on
Jun 8, 2010
Sold by
Nguyen Hong Lan
Bought by
Nguyen Hong Lan
Purchase Details
Closed on
Sep 1, 2005
Sold by
Nguyen Hong Lan and Tran Con Hien
Bought by
Nguyen Hong Lan
Home Financials for this Owner
Home Financials are based on the most recent Mortgage that was taken out on this home.
Original Mortgage
$495,300
Interest Rate
5.62%
Mortgage Type
Purchase Money Mortgage
Purchase Details
Closed on
Nov 2, 2004
Sold by
Relierford Walter E and Relierford Erma Jean
Bought by
Nguyen Honglan T and Tran Con Hien
Home Financials for this Owner
Home Financials are based on the most recent Mortgage that was taken out on this home.
Original Mortgage
$440,000
Interest Rate
4.12%
Mortgage Type
New Conventional
Purchase Details
Closed on
Nov 1, 2004
Sold by
Scholz Helmut
Bought by
Nguyen Honglan T
Home Financials for this Owner
Home Financials are based on the most recent Mortgage that was taken out on this home.
Original Mortgage
$440,000
Interest Rate
4.12%
Mortgage Type
New Conventional
Create a Home Valuation Report for This Property
The Home Valuation Report is an in-depth analysis detailing your home's value as well as a comparison with similar homes in the area
Home Values in the Area
Average Home Value in this Area
Purchase History
| Date | Buyer | Sale Price | Title Company |
|---|---|---|---|
| Dang Thang Huu | -- | Wfg National Title Ins Co | |
| Dang Thang Huu | -- | Orange Coast Title | |
| Nguyen Maggie Q | $119,500 | Chicago Title Company | |
| Nguyen Maggie Q | -- | First American Title Company | |
| Nguyen Maggie Giao | $435,000 | Orange Coast Title | |
| Nguyen Hong Lan | -- | None Available | |
| Nguyen Hong Lan | $248,000 | First American Title Company | |
| Nguyen Honglan T | $550,000 | Fidelity National Title Ins | |
| Nguyen Honglan T | -- | Fidelity National Title Ins | |
| Tran Con Hien | -- | Fidelity National Title Ins |
Source: Public Records
Mortgage History
| Date | Status | Borrower | Loan Amount |
|---|---|---|---|
| Open | Dang Thang Huu | $340,000 | |
| Closed | Dang Thang Huu | $350,000 | |
| Previous Owner | Nguyen Maggie Q | $339,000 | |
| Previous Owner | Nguyen Maggie Giao | $348,000 | |
| Previous Owner | Nguyen Hong Lan | $495,300 | |
| Previous Owner | Nguyen Honglan T | $440,000 | |
| Closed | Nguyen Honglan T | $55,000 |
Source: Public Records
Tax History Compared to Growth
Tax History
| Year | Tax Paid | Tax Assessment Tax Assessment Total Assessment is a certain percentage of the fair market value that is determined by local assessors to be the total taxable value of land and additions on the property. | Land | Improvement |
|---|---|---|---|---|
| 2025 | $12,175 | $864,165 | $568,218 | $295,947 |
| 2024 | $12,175 | $847,222 | $557,077 | $290,145 |
| 2023 | $11,742 | $830,610 | $546,154 | $284,456 |
| 2022 | $11,658 | $814,325 | $535,446 | $278,879 |
| 2021 | $11,741 | $798,359 | $524,948 | $273,411 |
| 2020 | $11,279 | $790,174 | $519,566 | $270,608 |
| 2019 | $11,009 | $774,681 | $509,379 | $265,302 |
| 2018 | $10,710 | $759,492 | $499,392 | $260,100 |
| 2017 | $10,569 | $744,600 | $489,600 | $255,000 |
| 2016 | $6,989 | $470,779 | $282,468 | $188,311 |
| 2015 | $6,986 | $463,709 | $278,226 | $185,483 |
| 2014 | $6,483 | $454,626 | $272,776 | $181,850 |
Source: Public Records
Map
Nearby Homes
- 3286 Dias Dr
- 2467 Flint Ave
- 2277 Flint Ave
- 2209 Fairmont Dr
- 3324 Trebol Ln
- 2689 Vista Verde Dr
- 3532 Boeger Ln
- 3514 Milburn St
- 2145 Mount Pleasant Rd
- 2017 Flintbury Ct
- 2715 Sugarplum Dr
- 2703 Klein Rd
- 2885 Mantis Dr
- 3156 Coldwater Dr
- 3144 Coldwater Dr
- 2859 Broken Oak Ct
- 3216 Remington Way
- 3146 Marten Ave
- 2708 Glen Ferguson Cir
- 3274 Mount Rainier Dr
- 2351 Flint Ave
- 2377 Flint Ave
- 2356 Portal Way
- 2368 Portal Way
- 2344 Portal Way
- 2339 Flint Ave
- 2385 Flint Ave
- 2380 Portal Way
- 2332 Portal Way
- 2327 Flint Ave
- 2399 Flint Ave
- 2392 Portal Way
- 2320 Portal Way
- 2313 Flint Ave
- 3342 Dias Dr
- 3347 Dias Dr
- 2308 Portal Way
- 3317 Floresta Dr
- 2301 Flint Ave
- 2400 Portal Way