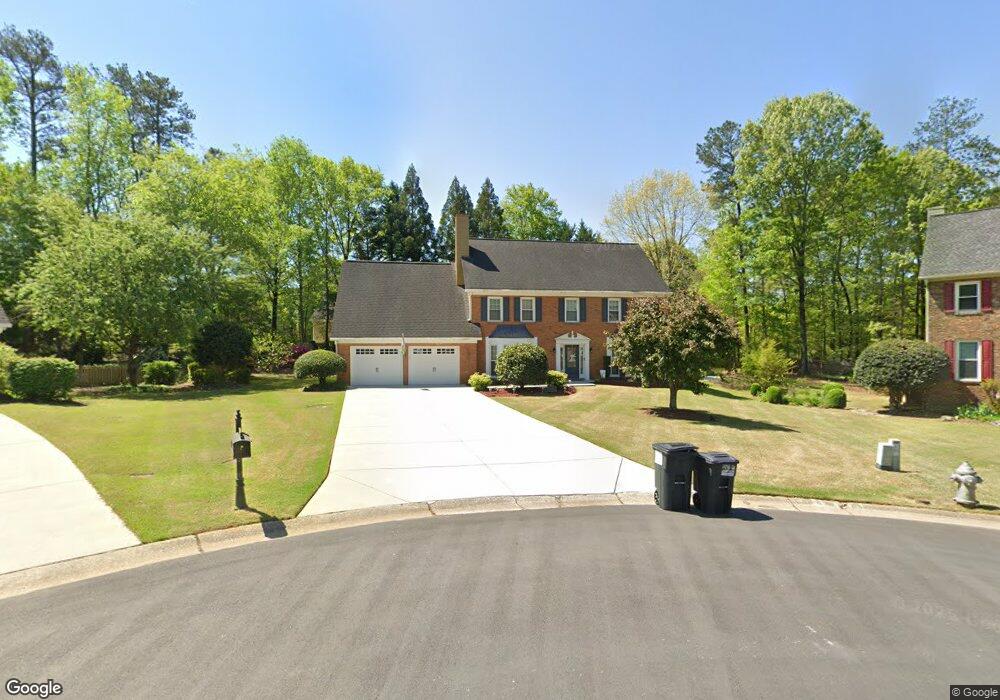
2365 Fenwick Ct SW Unit I Marietta, GA 30064
West Cobb NeighborhoodEstimated Value: $507,550 - $560,000
5
Beds
3
Baths
3,348
Sq Ft
$158/Sq Ft
Est. Value
About This Home
This home is located at 2365 Fenwick Ct SW Unit I, Marietta, GA 30064 and is currently estimated at $529,388, approximately $158 per square foot. 2365 Fenwick Ct SW Unit I is a home located in Cobb County with nearby schools including Cheatham Hill Elementary School, Lovinggood Middle School, and Hillgrove High School.
Ownership History
Date
Name
Owned For
Owner Type
Purchase Details
Closed on
May 9, 2022
Sold by
Leslie Oneill
Bought by
Stephen M Oneill And Leslie A Oneill Living T
Current Estimated Value
Purchase Details
Closed on
Jul 25, 2016
Sold by
Stephen M
Bought by
Oneill Stephen M and Oneill Leslie
Home Financials for this Owner
Home Financials are based on the most recent Mortgage that was taken out on this home.
Original Mortgage
$250,000
Interest Rate
3.56%
Mortgage Type
New Conventional
Purchase Details
Closed on
Aug 27, 2002
Sold by
Accettura Jerry W and Accettura Cynthia F
Bought by
O'Neill Stephen M and O'Neill Leslie T
Home Financials for this Owner
Home Financials are based on the most recent Mortgage that was taken out on this home.
Original Mortgage
$165,200
Interest Rate
3.63%
Mortgage Type
New Conventional
Create a Home Valuation Report for This Property
The Home Valuation Report is an in-depth analysis detailing your home's value as well as a comparison with similar homes in the area
Home Values in the Area
Average Home Value in this Area
Purchase History
| Date | Buyer | Sale Price | Title Company |
|---|---|---|---|
| Stephen M Oneill And Leslie A Oneill Living T | -- | Robert M Goldberg & Associates | |
| Oneill Stephen M | -- | -- | |
| O'Neill Stephen M | $206,500 | -- |
Source: Public Records
Mortgage History
| Date | Status | Borrower | Loan Amount |
|---|---|---|---|
| Previous Owner | Oneill Stephen M | $250,000 | |
| Previous Owner | O'Neill Stephen M | $165,200 |
Source: Public Records
Tax History Compared to Growth
Tax History
| Year | Tax Paid | Tax Assessment Tax Assessment Total Assessment is a certain percentage of the fair market value that is determined by local assessors to be the total taxable value of land and additions on the property. | Land | Improvement |
|---|---|---|---|---|
| 2025 | $1,135 | $179,800 | $30,000 | $149,800 |
| 2024 | $1,139 | $179,800 | $30,000 | $149,800 |
| 2023 | $933 | $179,800 | $30,000 | $149,800 |
| 2022 | $1,072 | $157,500 | $30,000 | $127,500 |
| 2021 | $3,378 | $135,496 | $24,000 | $111,496 |
| 2020 | $2,805 | $109,332 | $24,000 | $85,332 |
| 2019 | $2,805 | $109,332 | $24,000 | $85,332 |
| 2018 | $2,805 | $109,332 | $24,000 | $85,332 |
| 2017 | $2,575 | $103,852 | $24,000 | $79,852 |
| 2016 | $2,262 | $89,524 | $28,000 | $61,524 |
| 2015 | $2,317 | $89,524 | $28,000 | $61,524 |
| 2014 | $2,335 | $89,524 | $0 | $0 |
Source: Public Records
Map
Nearby Homes
- 2403 Bonshaw Ln
- 1239 Bonshaw Trail Unit 3
- 2563 Irwin Lake Overlook Rd SW
- 1227 Bonshaw Trail
- 1214 Bonshaw Trail
- 2093 Breconridge Dr SW
- 1884 Dovonshire Rd SW
- 1209 Wilkes Way SW Unit 1
- 1841 Edington Rd SW
- 994 Gentry Ln SW
- 1843 Edington Rd SW
- 1853 Edington Rd SW
- 1505 Old John Ward Rd SW
- 1518 Sage Ridge Dr
- 2040 Hardwood Cir SW Unit 3
- 2613 Lakefield Ct
- 1646 Desford Ct SW
- 1265 Channel Park SW
- 1331 Wynford Chase SW Unit 1
- 2341 Habersham Dr SW
- 2366 Fenwick Ct SW
- 2471 Hampton Glen Ct SW
- 2363 Fenwick Ct SW Unit U 1
- 2363 Fenwick Ct SW
- 2473 Hampton Glen Ct SW
- 2364 Fenwick Ct SW Unit 1
- 2469 Hampton Glen Ct SW Unit 2
- 2361 Fenwick Ct SW
- 1441 Fenwick Dr SW
- 2362 Fenwick Ct SW Unit 1
- 2475 Hampton Glen Ct SW
- 2308 Edisto Place SW
- 1439 Fenwick Dr SW
- 2306 Edisto Place SW
- 2468 Hampton Glen Ct SW
- 1437 Fenwick Dr SW Unit 91
- 1437 Fenwick Dr SW
- 2359 Fenwick Ct SW
- 1427 Fenwick Dr SW
- 1427 Fenwick Dr SW Unit 89