E
Seller's Agent in 2025
Ed Li
Real People Realty
(312) 451-6628
1 in this area
3 Total Sales
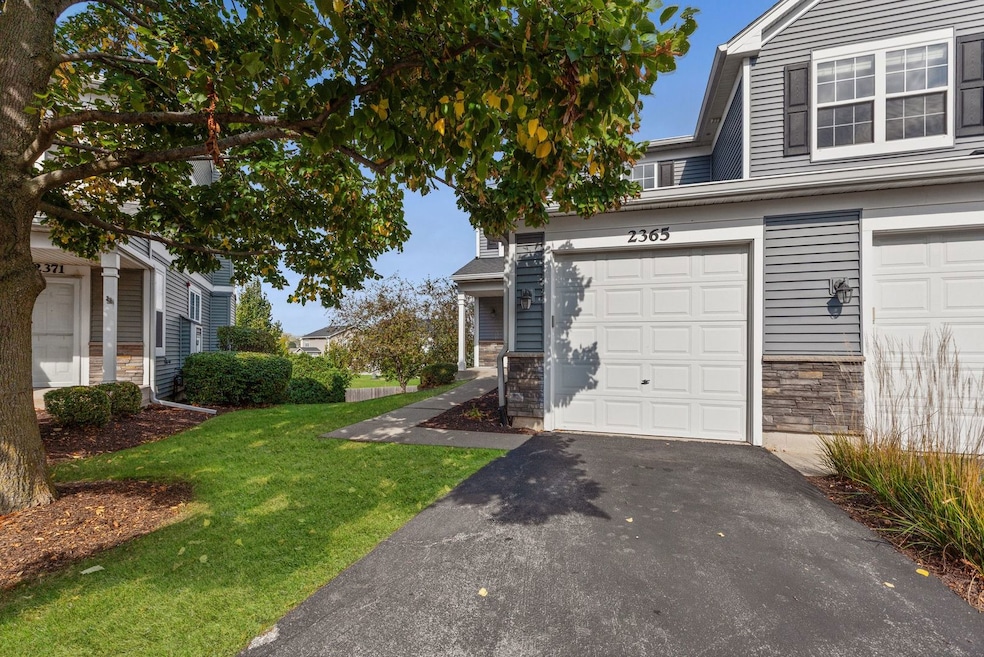
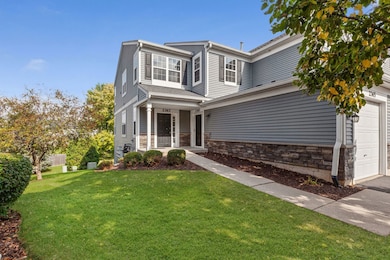
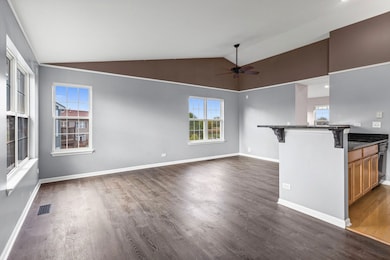
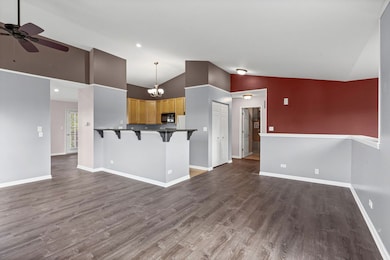
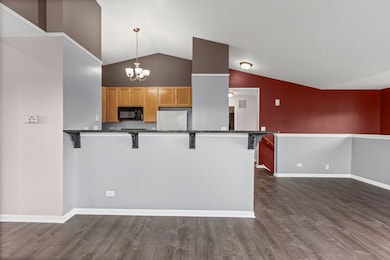
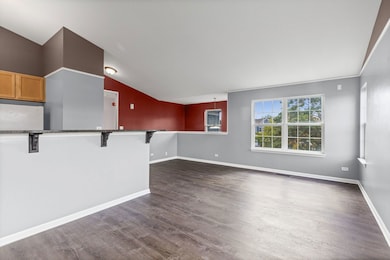
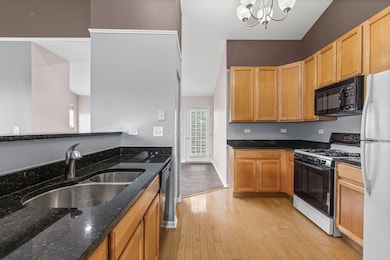
Experience comfort and style in this beautifully updated end unit second-floor ranch-style townhome with an attached garage. 2 bedrooms and 2 full bathrooms, both with tubs. Freshly painted throughout, this home features brand-new carpet in the bedrooms, new luxury flooring and lighting fixtures in the living area, and an upgraded kitchen with granite countertops. Enjoy the spacious interiors vaulted ceilings, multitude of windows, gas fireplace and new ceiling fans, making for a bright, inviting atmosphere perfect for relaxing or entertaining. The primary bedroom has vaulted ceilings, an ensuite bathroom and a walk in closet. Nestled within an award-winning school district and located just minutes from the Metro station and I-88 highway, this residence offers exceptional convenience to shopping, dining, and entertainment. HOA covers lawn care, snow removal and more. Pet and rental friendly.
Last Agent to Sell the Property
Real People Realty Brokerage Phone: (312) 451-6628 License #475198193 Listed on: 10/18/2025
| Date | Type | Sale Price | Title Company |
|---|---|---|---|
| Warranty Deed | $305,000 | None Listed On Document | |
| Warranty Deed | $169,000 | Multiple | |
| Warranty Deed | $148,000 | Fidelity National Title | |
| Warranty Deed | $167,000 | -- |
| Date | Status | Loan Amount | Loan Type |
|---|---|---|---|
| Previous Owner | $126,750 | New Conventional | |
| Previous Owner | $133,200 | Adjustable Rate Mortgage/ARM | |
| Previous Owner | $133,304 | No Value Available |
| Date | Event | Price | List to Sale | Price per Sq Ft |
|---|---|---|---|---|
| 11/14/2025 11/14/25 | Sold | $305,000 | -3.2% | $202 / Sq Ft |
| 11/03/2025 11/03/25 | Pending | -- | -- | -- |
| 10/18/2025 10/18/25 | For Sale | $315,000 | -- | $209 / Sq Ft |
| Year | Tax Paid | Tax Assessment Tax Assessment Total Assessment is a certain percentage of the fair market value that is determined by local assessors to be the total taxable value of land and additions on the property. | Land | Improvement |
|---|---|---|---|---|
| 2024 | $5,343 | $85,593 | $16,604 | $68,989 |
| 2023 | $5,142 | $76,910 | $14,920 | $61,990 |
| 2022 | $4,952 | $72,460 | $14,060 | $58,400 |
| 2021 | $4,803 | $69,880 | $13,560 | $56,320 |
| 2020 | $4,797 | $69,880 | $13,560 | $56,320 |
| 2019 | $4,618 | $66,470 | $12,900 | $53,570 |
| 2018 | $4,306 | $60,830 | $17,520 | $43,310 |
| 2017 | $4,194 | $58,770 | $16,930 | $41,840 |
| 2016 | $3,687 | $56,400 | $16,250 | $40,150 |
| 2015 | $3,638 | $53,550 | $15,430 | $38,120 |
| 2014 | $3,558 | $50,880 | $14,660 | $36,220 |
| 2013 | $3,551 | $51,230 | $14,760 | $36,470 |
E
Seller's Agent in 2025
Ed Li
Real People Realty
(312) 451-6628
1 in this area
3 Total Sales

Buyer's Agent in 2025
Taurese Stinnett
Berkshire Hathaway HomeServices Chicago
(630) 402-7160
1 in this area
3 Total Sales
Source: Midwest Real Estate Data (MRED)
MLS Number: 12498759
APN: 07-09-310-254
Disclaimer: Certain information contained herein is derived from information provided by parties other than Homes.com. All information provided is deemed reliable, but is not guaranteed to be accurate and should be independently verified.
![]() Based on information submitted to the MLS GRID. All data is obtained from various sources and may not have been verified by broker or MLS GRID. Supplied Open House Information is subject to change without notice. All information should be independently reviewed and verified for accuracy. Properties may or may not be listed by the office/agent presenting the information. Some IDX listings have been excluded from this website.
Based on information submitted to the MLS GRID. All data is obtained from various sources and may not have been verified by broker or MLS GRID. Supplied Open House Information is subject to change without notice. All information should be independently reviewed and verified for accuracy. Properties may or may not be listed by the office/agent presenting the information. Some IDX listings have been excluded from this website.
Based on information submitted to the MLS GRID
Ask me questions while you tour the home.