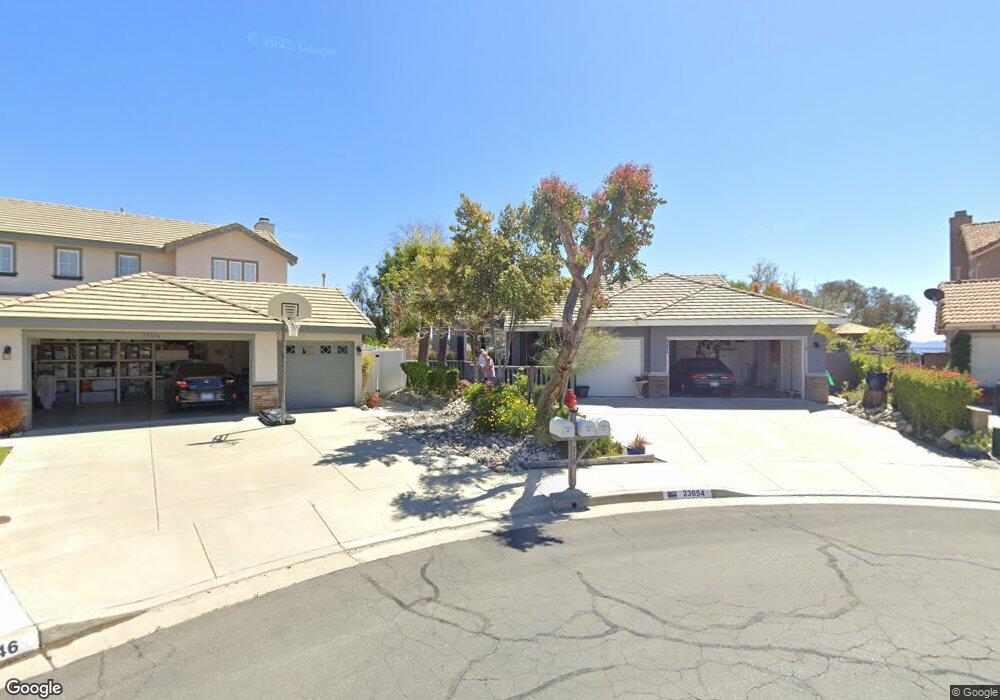
23654 Silkwood Ct Murrieta, CA 92562
Estimated Value: $620,000 - $708,000
4
Beds
2
Baths
1,798
Sq Ft
$371/Sq Ft
Est. Value
About This Home
This home is located at 23654 Silkwood Ct, Murrieta, CA 92562 and is currently estimated at $666,307, approximately $370 per square foot. 23654 Silkwood Ct is a home located in Riverside County with nearby schools including Tovashal Elementary School, Thompson Middle School, and Murrieta Valley High School.
Ownership History
Date
Name
Owned For
Owner Type
Purchase Details
Closed on
Jun 24, 2002
Sold by
Waroff Steven L and Waroff Ann J
Bought by
Waroff Steven L and Waroff Ann J
Current Estimated Value
Home Financials for this Owner
Home Financials are based on the most recent Mortgage that was taken out on this home.
Original Mortgage
$166,900
Interest Rate
6.69%
Purchase Details
Closed on
Jul 14, 2000
Sold by
Waroff Steven L and Waroff Ann J
Bought by
Waroff Steven L and Waroff Ann J
Purchase Details
Closed on
Jan 11, 1996
Sold by
Richmond American Homes Of Ca Inc
Bought by
Waroff Steven L and Waroff Ann J
Home Financials for this Owner
Home Financials are based on the most recent Mortgage that was taken out on this home.
Original Mortgage
$157,584
Interest Rate
7.25%
Mortgage Type
VA
Create a Home Valuation Report for This Property
The Home Valuation Report is an in-depth analysis detailing your home's value as well as a comparison with similar homes in the area
Home Values in the Area
Average Home Value in this Area
Purchase History
| Date | Buyer | Sale Price | Title Company |
|---|---|---|---|
| Waroff Steven L | -- | American Title | |
| Waroff Steven L | -- | -- | |
| Waroff Steven L | $152,000 | North American Title Co |
Source: Public Records
Mortgage History
| Date | Status | Borrower | Loan Amount |
|---|---|---|---|
| Closed | Waroff Steven L | $166,900 | |
| Closed | Waroff Steven L | $157,584 |
Source: Public Records
Tax History Compared to Growth
Tax History
| Year | Tax Paid | Tax Assessment Tax Assessment Total Assessment is a certain percentage of the fair market value that is determined by local assessors to be the total taxable value of land and additions on the property. | Land | Improvement |
|---|---|---|---|---|
| 2025 | $2,905 | $256,625 | $58,123 | $198,502 |
| 2023 | $2,905 | $246,662 | $55,867 | $190,795 |
| 2022 | $2,892 | $241,826 | $54,772 | $187,054 |
| 2021 | $2,838 | $237,086 | $53,699 | $183,387 |
| 2020 | $2,810 | $234,656 | $53,149 | $181,507 |
| 2019 | $2,758 | $230,056 | $52,107 | $177,949 |
| 2018 | $2,707 | $225,546 | $51,087 | $174,459 |
| 2017 | $2,670 | $221,125 | $50,086 | $171,039 |
| 2016 | $2,635 | $216,790 | $49,104 | $167,686 |
| 2015 | $2,608 | $213,535 | $48,367 | $165,168 |
| 2014 | $2,491 | $209,354 | $47,420 | $161,934 |
Source: Public Records
Map
Nearby Homes
- 23634 Underwood Cir
- 39944 Spicewood Ave
- 40049 Corte Fortuna
- 39785 Spinning Wheel Dr
- 23727 Corte Andar
- 23825 Matador Way
- 40311 Via Ambiente
- 23832 Matador Way
- 36029 Mustang Spirit Ln
- 36060 Lipizzan Ln
- 39634 Cornhusk Cir
- 23466 Saratoga Springs Place
- 39823 Hillsboro Cir
- 23573 Spindle Way
- 39560 Tinderbox Way
- 23832 Castinette Way
- 23501 Brigin Place
- 23825 Five Tribes Trail
- 23489 Brigin Place
- 40146 Colony Dr
- 23646 Silkwood Ct
- 23643 Silkwood Ct
- 23634 Silkwood Ct
- 23635 Silkwood Ct
- 23627 Silkwood Ct
- 23626 Silkwood Ct
- 23619 Silkwood Ct
- 23614 Silkwood Ct
- 23626 Underwood Cir
- 23611 Silkwood Ct
- 23618 Underwood Cir
- 23606 Silkwood Ct
- 23642 Underwood Cir
- 23610 Underwood Cir
- 23603 Silkwood Ct
- 23602 Underwood Cir
- 40347 Crystal Aire Ct
- 40230 Spinning Wheel Dr
- 23594 Silkwood Ct
- 40339 Crystal Aire Ct