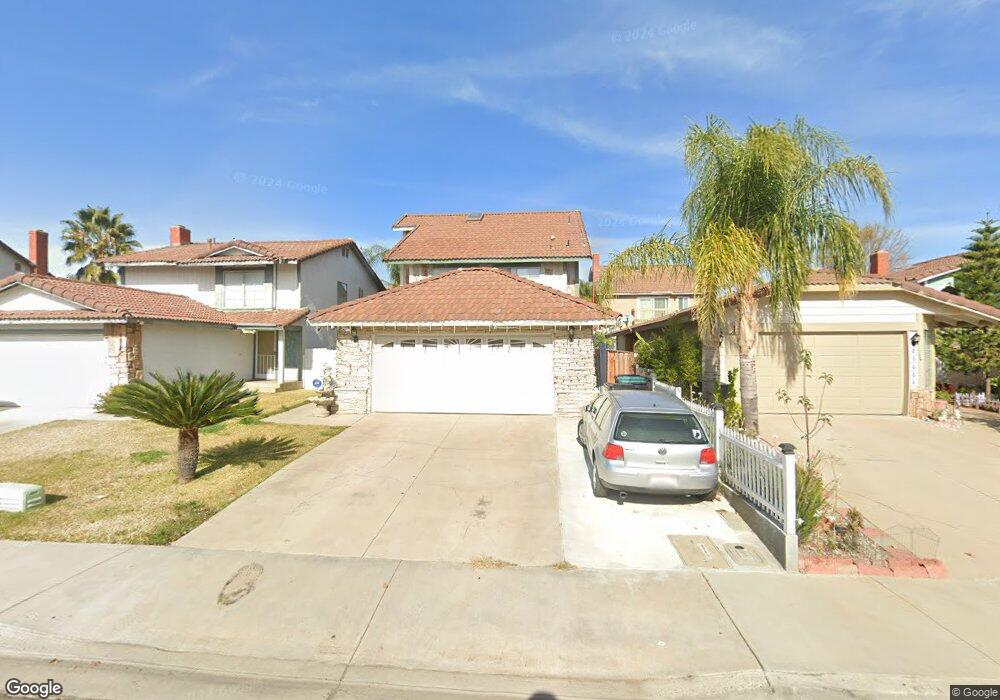
23656 Blooming Meadow Rd Moreno Valley, CA 92557
North Moreno Valley NeighborhoodEstimated Value: $507,648 - $545,000
3
Beds
3
Baths
1,600
Sq Ft
$329/Sq Ft
Est. Value
About This Home
This home is located at 23656 Blooming Meadow Rd, Moreno Valley, CA 92557 and is currently estimated at $527,162, approximately $329 per square foot. 23656 Blooming Meadow Rd is a home located in Riverside County with nearby schools including Honey Hollow Elementary School, Vista Heights Middle School, and Canyon Springs High School.
Ownership History
Date
Name
Owned For
Owner Type
Purchase Details
Closed on
Jul 3, 1998
Sold by
Martinez Gerardo
Bought by
Ruiz Fermin and Ruiz Pilar
Current Estimated Value
Purchase Details
Closed on
Feb 12, 1998
Sold by
Hud
Bought by
Martinez Gerardo and Ruiz Fermin
Home Financials for this Owner
Home Financials are based on the most recent Mortgage that was taken out on this home.
Original Mortgage
$86,288
Interest Rate
7.18%
Mortgage Type
FHA
Purchase Details
Closed on
Oct 14, 1997
Sold by
Norwest Mtg Inc
Bought by
Hud
Purchase Details
Closed on
Jun 12, 1997
Sold by
Gakere Nancy N and Gakere Ann M
Bought by
Norwest Mtg Inc
Purchase Details
Closed on
Jul 31, 1995
Sold by
Becraft Jim
Bought by
Gakere Nanc N and Gakere Ann M
Home Financials for this Owner
Home Financials are based on the most recent Mortgage that was taken out on this home.
Original Mortgage
$91,360
Interest Rate
7.88%
Mortgage Type
FHA
Create a Home Valuation Report for This Property
The Home Valuation Report is an in-depth analysis detailing your home's value as well as a comparison with similar homes in the area
Home Values in the Area
Average Home Value in this Area
Purchase History
| Date | Buyer | Sale Price | Title Company |
|---|---|---|---|
| Ruiz Fermin | -- | -- | |
| Martinez Gerardo | $87,000 | Stewart Title Company | |
| Hud | -- | First American Title Ins Co | |
| Norwest Mtg Inc | $101,114 | First American Title Ins Co | |
| Gakere Nanc N | $91,500 | Orange Coast Title |
Source: Public Records
Mortgage History
| Date | Status | Borrower | Loan Amount |
|---|---|---|---|
| Previous Owner | Martinez Gerardo | $86,288 | |
| Previous Owner | Gakere Nanc N | $91,360 |
Source: Public Records
Tax History Compared to Growth
Tax History
| Year | Tax Paid | Tax Assessment Tax Assessment Total Assessment is a certain percentage of the fair market value that is determined by local assessors to be the total taxable value of land and additions on the property. | Land | Improvement |
|---|---|---|---|---|
| 2025 | $1,816 | $150,109 | $27,321 | $122,788 |
| 2023 | $1,816 | $144,282 | $26,261 | $118,021 |
| 2022 | $1,750 | $141,454 | $25,747 | $115,707 |
| 2021 | $1,720 | $138,682 | $25,243 | $113,439 |
| 2020 | $1,722 | $137,261 | $24,985 | $112,276 |
| 2019 | $1,695 | $134,571 | $24,496 | $110,075 |
| 2018 | $1,668 | $131,933 | $24,017 | $107,916 |
| 2017 | $1,631 | $129,347 | $23,547 | $105,800 |
| 2016 | $1,643 | $126,812 | $23,086 | $103,726 |
| 2015 | $1,621 | $124,910 | $22,741 | $102,169 |
| 2014 | $1,519 | $122,466 | $22,297 | $100,169 |
Source: Public Records
Map
Nearby Homes
- 11956 Bayless St
- 23410 Woodlander Way
- 23820 Ironwood Ave Unit 173
- 23820 Ironwood Ave Unit 130
- 23820 Ironwood Ave Unit 215
- 23820 Ironwood Ave Unit 158
- 23820 Ironwood Ave Unit 191
- 12045 Bayless St
- 23326 Elfin Place
- 23921 Ironwood Ave
- 12178 Zinnia St
- 11412 Pickford Way
- 23402 Harland Dr
- 24116 Kernwood Dr
- 11830 Carlisle Ct
- 23610 David Ln
- 11559 Parakeet Ct
- 23919 Mark Twain
- 0 Ocala Ct Unit IG25071172
- 23886 Mark Twain
- 23648 Blooming Meadow Rd
- 23664 Blooming Meadow Rd
- 23640 Blooming Meadow Rd
- 23672 Blooming Meadow Rd
- 11817 Briar Knoll Place
- 11809 Briar Knoll Place
- 23632 Blooming Meadow Rd
- 11825 Briar Knoll Place
- 11801 Briar Knoll Place
- 11833 Briar Knoll Place
- 11831 Bayless St
- 23680 Blooming Meadow Rd
- 23624 Blooming Meadow Rd
- 11841 Briar Knoll Place
- 23649 Blooming Meadow Rd
- 11793 Briar Knoll Place
- 23641 Blooming Meadow Rd
- 11839 Bayless St
- 11849 Briar Knoll Place
- 23616 Blooming Meadow Rd