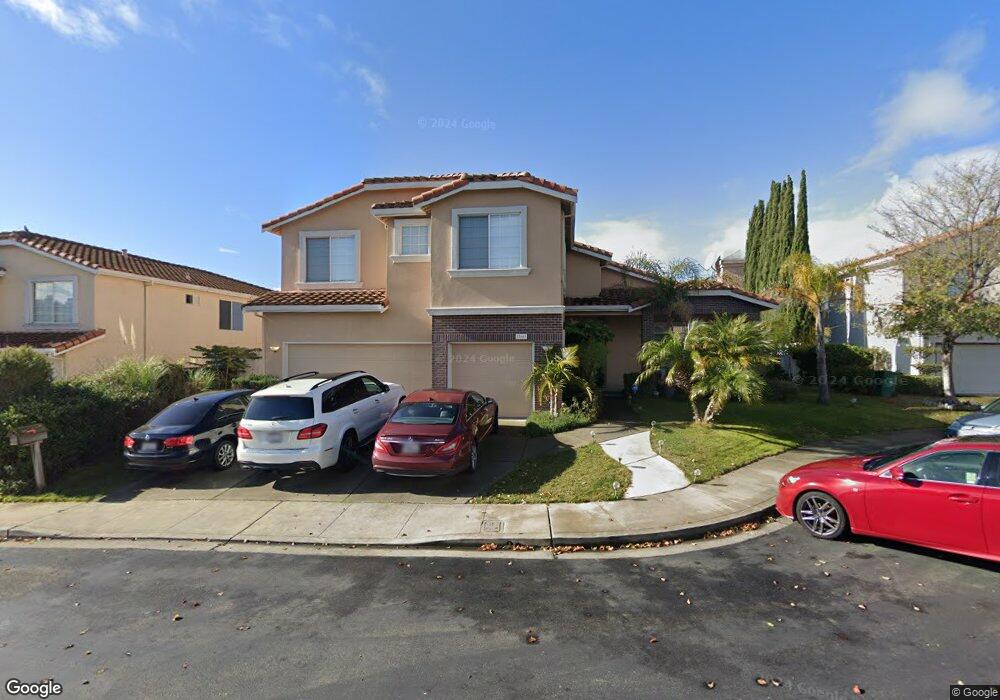
23663 Carlson Ct Hayward, CA 94541
Estimated Value: $1,571,446 - $1,825,000
5
Beds
3
Baths
3,228
Sq Ft
$518/Sq Ft
Est. Value
About This Home
This home is located at 23663 Carlson Ct, Hayward, CA 94541 and is currently estimated at $1,672,612, approximately $518 per square foot. 23663 Carlson Ct is a home located in Alameda County with nearby schools including Fairview Elementary School, Bret Harte Middle School, and Hayward High School.
Ownership History
Date
Name
Owned For
Owner Type
Purchase Details
Closed on
Jul 6, 1999
Sold by
Wmc Mtg Corp
Bought by
Osman Sheraz and Osman Khalida
Current Estimated Value
Home Financials for this Owner
Home Financials are based on the most recent Mortgage that was taken out on this home.
Original Mortgage
$374,400
Outstanding Balance
$105,536
Interest Rate
7.64%
Mortgage Type
Stand Alone First
Estimated Equity
$1,567,076
Purchase Details
Closed on
Jan 26, 1999
Sold by
Stoertzer Doris
Bought by
Wmc Mtg Corp
Purchase Details
Closed on
Jun 24, 1996
Sold by
Mirkhani Farhad and Mirkhani Manijeh
Bought by
Stoertzer Doris
Home Financials for this Owner
Home Financials are based on the most recent Mortgage that was taken out on this home.
Original Mortgage
$331,590
Interest Rate
8.3%
Create a Home Valuation Report for This Property
The Home Valuation Report is an in-depth analysis detailing your home's value as well as a comparison with similar homes in the area
Home Values in the Area
Average Home Value in this Area
Purchase History
| Date | Buyer | Sale Price | Title Company |
|---|---|---|---|
| Osman Sheraz | $468,000 | Fidelity National Title Co | |
| Wmc Mtg Corp | $531,889 | Fidelity National Title Ins | |
| Stoertzer Doris | $474,000 | American Title Ins Co |
Source: Public Records
Mortgage History
| Date | Status | Borrower | Loan Amount |
|---|---|---|---|
| Open | Osman Sheraz | $374,400 | |
| Previous Owner | Stoertzer Doris | $331,590 |
Source: Public Records
Tax History Compared to Growth
Tax History
| Year | Tax Paid | Tax Assessment Tax Assessment Total Assessment is a certain percentage of the fair market value that is determined by local assessors to be the total taxable value of land and additions on the property. | Land | Improvement |
|---|---|---|---|---|
| 2025 | $9,160 | $719,263 | $215,164 | $504,099 |
| 2024 | $9,160 | $705,163 | $210,946 | $494,217 |
| 2023 | $9,053 | $691,338 | $206,810 | $484,528 |
| 2022 | $8,854 | $677,785 | $202,756 | $475,029 |
| 2021 | $8,756 | $664,498 | $198,781 | $465,717 |
| 2020 | $8,629 | $657,688 | $196,744 | $460,944 |
| 2019 | $8,676 | $644,795 | $192,887 | $451,908 |
| 2018 | $8,138 | $632,155 | $189,106 | $443,049 |
| 2017 | $7,937 | $619,762 | $185,399 | $434,363 |
| 2016 | $7,493 | $607,612 | $181,764 | $425,848 |
| 2015 | $7,332 | $598,486 | $179,034 | $419,452 |
| 2014 | $6,966 | $586,763 | $175,527 | $411,236 |
Source: Public Records
Map
Nearby Homes
- 3260 Jamie Way
- 23380 Lakeridge Ave
- 2980 D St
- 2936 Pickford Way
- 24392 Machado Ct
- 3109 Vista Ln
- 23066 Maud Ave
- 23920 Mayville Dr
- 23730 Stratton Ct
- 3606 Sarita St
- 3287 Kelly St
- 22633 Mossy Rock Dr
- 23661 Glenbrook Ln
- 23022 Palazzo Del Kayla
- 22561 Mossy Rock Dr
- 2468 Hidden Ln
- 22679 Valley View Dr
- 3241 Monika Ln
- 2214 D St
- 3285 Monika Ln
- 23701 Carlson Ct
- 23625 Carlson Ct
- 23739 Carlson Ct
- 23668 Carlson Ct
- 23587 Carlson Ct
- 23706 Carlson Ct
- 23630 Carlson Ct
- 23592 Carlson Ct
- 23777 Carlson Ct
- 23744 Carlson Ct
- 23521 Lauren Place
- 23539 Lauren Place
- 3270 Ohlone Way
- 23557 Lauren Place
- 3211 Jamie Way
- 3205 Jamie Way
- 23782 Carlson Ct
- 3230 D St
- 23815 Carlson Ct
- 23598 Matthew Ct