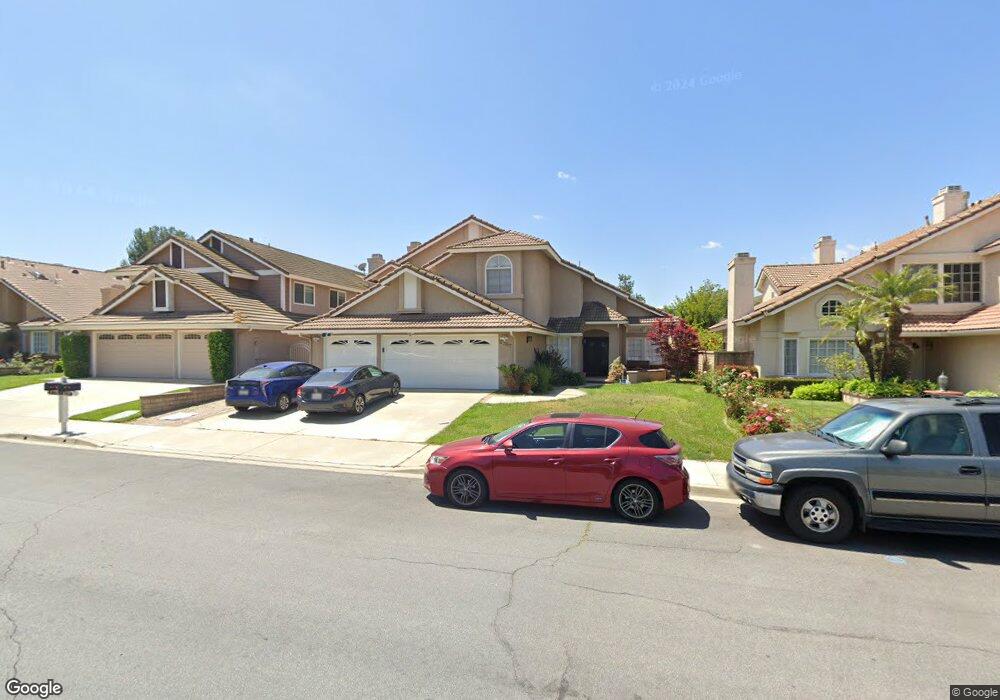
2367 Meadow Ridge Dr Chino Hills, CA 91709
North Chino Hills NeighborhoodEstimated Value: $1,298,000 - $1,475,000
4
Beds
3
Baths
2,588
Sq Ft
$527/Sq Ft
Est. Value
About This Home
This home is located at 2367 Meadow Ridge Dr, Chino Hills, CA 91709 and is currently estimated at $1,362,967, approximately $526 per square foot. 2367 Meadow Ridge Dr is a home located in San Bernardino County with nearby schools including Country Springs Elementary School, Canyon Hills Junior High School, and Ruben S. Ayala High School.
Ownership History
Date
Name
Owned For
Owner Type
Purchase Details
Closed on
Sep 20, 2011
Sold by
Teran Daniel and Teran Lillian
Bought by
Sales Nelson C and Sales Jennifer F
Current Estimated Value
Home Financials for this Owner
Home Financials are based on the most recent Mortgage that was taken out on this home.
Original Mortgage
$448,000
Outstanding Balance
$306,788
Interest Rate
4.26%
Mortgage Type
New Conventional
Estimated Equity
$1,056,179
Purchase Details
Closed on
Jul 12, 2006
Sold by
Salazar Arturo and Salazar Amparo
Bought by
Teran Daniel and Teran Lillian
Home Financials for this Owner
Home Financials are based on the most recent Mortgage that was taken out on this home.
Original Mortgage
$620,000
Interest Rate
6.76%
Mortgage Type
Purchase Money Mortgage
Create a Home Valuation Report for This Property
The Home Valuation Report is an in-depth analysis detailing your home's value as well as a comparison with similar homes in the area
Home Values in the Area
Average Home Value in this Area
Purchase History
| Date | Buyer | Sale Price | Title Company |
|---|---|---|---|
| Sales Nelson C | $560,000 | Ticor Title Company | |
| Teran Daniel | $775,000 | Lawyers Title |
Source: Public Records
Mortgage History
| Date | Status | Borrower | Loan Amount |
|---|---|---|---|
| Open | Sales Nelson C | $448,000 | |
| Previous Owner | Teran Daniel | $620,000 |
Source: Public Records
Tax History Compared to Growth
Tax History
| Year | Tax Paid | Tax Assessment Tax Assessment Total Assessment is a certain percentage of the fair market value that is determined by local assessors to be the total taxable value of land and additions on the property. | Land | Improvement |
|---|---|---|---|---|
| 2025 | $8,048 | $703,393 | $246,188 | $457,205 |
| 2024 | $8,048 | $689,601 | $241,361 | $448,240 |
| 2023 | $7,837 | $676,079 | $236,628 | $439,451 |
| 2022 | $7,792 | $662,822 | $231,988 | $430,834 |
| 2021 | $7,649 | $649,825 | $227,439 | $422,386 |
| 2020 | $7,555 | $643,162 | $225,107 | $418,055 |
| 2019 | $7,430 | $630,551 | $220,693 | $409,858 |
| 2018 | $7,276 | $618,188 | $216,366 | $401,822 |
| 2017 | $7,154 | $606,067 | $212,124 | $393,943 |
| 2016 | $6,715 | $594,184 | $207,965 | $386,219 |
| 2015 | $6,589 | $585,259 | $204,841 | $380,418 |
| 2014 | $7,021 | $573,794 | $200,828 | $372,966 |
Source: Public Records
Map
Nearby Homes
- 2286 Black Pine Rd
- 2460 Windmill Creek Rd
- 14726 Moon Crest Ln Unit E
- 14748 Moon Crest Ln Unit E
- 2432 Moon Dust Dr Unit B
- 2515 Pointe Coupee
- 14171 Shoreline Dr
- 2509 Moon Dust Dr Unit A
- 14155 Applegate Ln
- 1839 Nordic Ave
- 15075 Avenida Del Monte
- 15036 Calle la Paloma
- 2024 Vista Del Sol
- 15085 Calle Verano
- 3056 Giant Forest Loop
- 13663 Monteverde Dr
- 3159 Morningfield Dr
- 3167 Morningfield Dr
- 3199 Morningfield Dr
- 15429 Turquoise Cir N
- 2359 Meadow Ridge Dr
- 2375 Meadow Ridge Dr
- 2351 Meadow Ridge Dr
- 2383 Meadow Ridge Dr
- 2374 Meadow Ridge Dr
- 2391 Meadow Ridge Dr
- 2343 Meadow Ridge Dr
- 2382 Meadow Ridge Dr
- 2358 Meadow Ridge Dr
- 14451 Autumn Hill Ln
- 14445 Autumn Hill Ln
- 14459 Autumn Hill Ln
- 2390 Meadow Ridge Dr
- 14439 Autumn Hill Ln
- 14467 Autumn Hill Ln
- 14433 Autumn Hill Ln
- 2399 Meadow Ridge Dr
- 14475 Autumn Hill Ln
- 2350 Meadow Ridge Dr
- 14427 Autumn Hill Ln