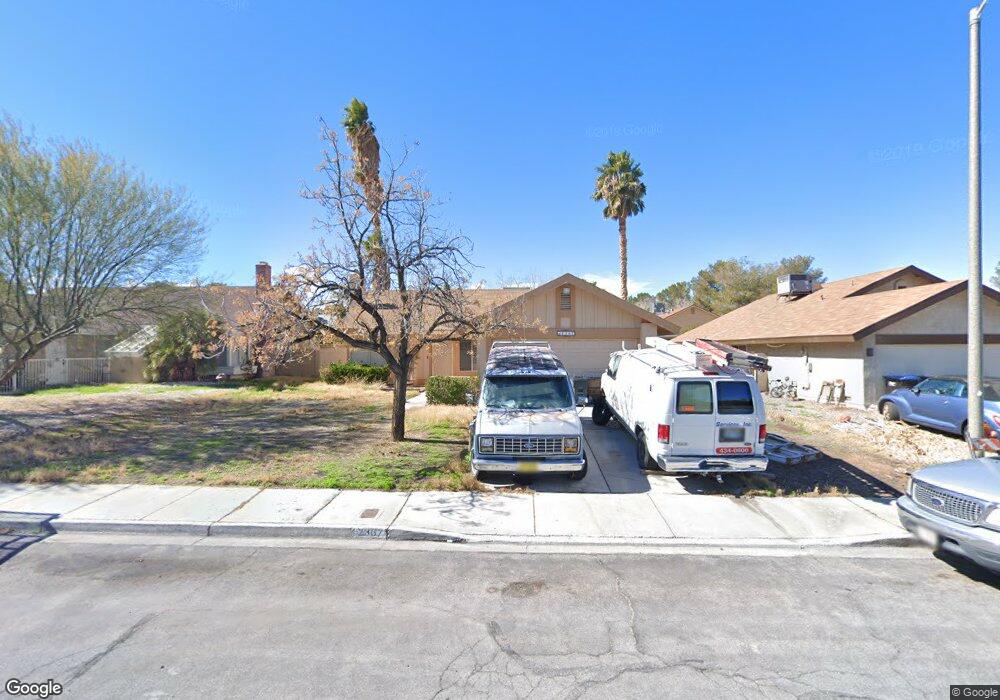
2367 Moorpark Way Henderson, NV 89014
Green Valley North NeighborhoodEstimated Value: $400,000 - $424,000
3
Beds
2
Baths
1,303
Sq Ft
$315/Sq Ft
Est. Value
About This Home
This home is located at 2367 Moorpark Way, Henderson, NV 89014 and is currently estimated at $410,767, approximately $315 per square foot. 2367 Moorpark Way is a home located in Clark County with nearby schools including Nate Mack Elementary School, Barbara and Hank Greenspun Junior High School, and Green Valley High School.
Ownership History
Date
Name
Owned For
Owner Type
Purchase Details
Closed on
Aug 21, 2007
Sold by
Fisher Roger Allan and Fisher Rena Alane
Bought by
Fisher Roger Allan and Fisher Rena Alane
Current Estimated Value
Purchase Details
Closed on
May 23, 2007
Sold by
Fisher Roger Allan and Fisher Rena Alane
Bought by
Fisher Roger Allan and Fisher Rena Alane
Home Financials for this Owner
Home Financials are based on the most recent Mortgage that was taken out on this home.
Original Mortgage
$199,500
Outstanding Balance
$121,416
Interest Rate
6.18%
Mortgage Type
New Conventional
Estimated Equity
$289,351
Purchase Details
Closed on
Oct 26, 2004
Sold by
Fisher Roger A and Fisher Rena
Bought by
Fisher Roger Allan and Fisher Rena Alane
Purchase Details
Closed on
Jan 24, 1997
Sold by
Murawski James S and Murawski Deborah J
Bought by
Fisher Roger A and Fisher Rena
Home Financials for this Owner
Home Financials are based on the most recent Mortgage that was taken out on this home.
Original Mortgage
$94,500
Interest Rate
7.86%
Create a Home Valuation Report for This Property
The Home Valuation Report is an in-depth analysis detailing your home's value as well as a comparison with similar homes in the area
Home Values in the Area
Average Home Value in this Area
Purchase History
| Date | Buyer | Sale Price | Title Company |
|---|---|---|---|
| Fisher Roger Allan | -- | None Available | |
| Fisher Roger Allan | -- | Southwest Title | |
| Fisher Roger Allan | -- | -- | |
| Fisher Roger A | $126,000 | Old Republic Title Company |
Source: Public Records
Mortgage History
| Date | Status | Borrower | Loan Amount |
|---|---|---|---|
| Open | Fisher Roger Allan | $199,500 | |
| Closed | Fisher Roger A | $94,500 |
Source: Public Records
Tax History Compared to Growth
Tax History
| Year | Tax Paid | Tax Assessment Tax Assessment Total Assessment is a certain percentage of the fair market value that is determined by local assessors to be the total taxable value of land and additions on the property. | Land | Improvement |
|---|---|---|---|---|
| 2025 | $1,711 | $68,146 | $37,450 | $30,696 |
| 2024 | $1,585 | $68,146 | $37,450 | $30,696 |
| 2023 | $1,585 | $65,518 | $35,350 | $30,168 |
| 2022 | $1,468 | $58,938 | $30,590 | $28,348 |
| 2021 | $1,360 | $53,988 | $26,600 | $27,388 |
| 2020 | $1,260 | $52,184 | $24,500 | $27,684 |
| 2019 | $1,180 | $49,793 | $22,050 | $27,743 |
| 2018 | $1,126 | $47,165 | $19,950 | $27,215 |
| 2017 | $1,381 | $47,649 | $19,600 | $28,049 |
| 2016 | $1,055 | $43,173 | $14,350 | $28,823 |
| 2015 | $1,052 | $40,063 | $11,200 | $28,863 |
| 2014 | $1,022 | $38,519 | $9,625 | $28,894 |
Source: Public Records
Map
Nearby Homes
- 15 Pheasant Ridge Dr
- 3135 La Mesa Dr
- 3117 Valleywood Rd
- 3159 Vistoso Cir
- 30 Quail Hollow Dr
- 3147 Viewcrest Ave
- 128 Quail Run Rd
- 3135 La Mancha Way
- 3630 Tobias Ln
- 3784 Pama Ln
- 3138 White Rose Way
- 112 Quail Run Rd
- 3105 La Mancha Way
- 3585 Tobias Ln
- 2406 El Brio Ct
- 108 Quail Run Rd
- 3411 Sunfish Dr Unit B
- 2212 Sunfish Dr Unit C
- 3530 Cosima Ln
- 3128 Regal Oak Dr
- 2369 Moorpark Way
- 2365 Moorpark Way
- 2368 Viewcrest Rd
- 2371 Moorpark Way
- 2363 Moorpark Way
- 2366 Viewcrest Rd
- 3150 Floral Vista Ave
- 2372 Viewcrest Rd
- 2364 Viewcrest Rd
- 2364 Moorpark Way
- 2373 Moorpark Way Unit 2
- 2361 Moorpark Way
- 2374 Viewcrest Rd
- 2362 Moorpark Way
- 3148 Floral Vista Ave
- 3151 Belvedere Dr
- 2359 Moorpark Way
- 3145 Floral Vista Ave
- 2360 Viewcrest Rd