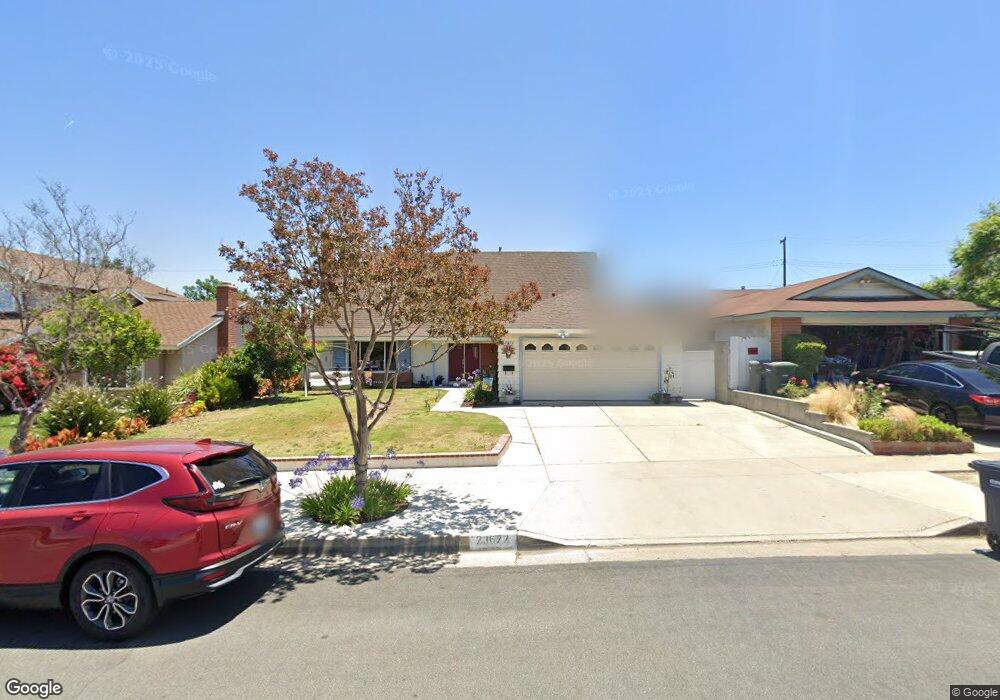
23672 Dune Mear Rd Lake Forest, CA 92630
Estimated Value: $1,208,000 - $1,256,000
4
Beds
2
Baths
2,117
Sq Ft
$581/Sq Ft
Est. Value
About This Home
This home is located at 23672 Dune Mear Rd, Lake Forest, CA 92630 and is currently estimated at $1,230,497, approximately $581 per square foot. 23672 Dune Mear Rd is a home located in Orange County with nearby schools including Olivewood Elementary School, Serrano Intermediate School, and El Toro High School.
Ownership History
Date
Name
Owned For
Owner Type
Purchase Details
Closed on
Jan 3, 2014
Sold by
Tellez Olivia V
Bought by
Tellez Olivia
Current Estimated Value
Home Financials for this Owner
Home Financials are based on the most recent Mortgage that was taken out on this home.
Original Mortgage
$100,100
Outstanding Balance
$75,191
Interest Rate
4.26%
Mortgage Type
New Conventional
Estimated Equity
$1,155,306
Purchase Details
Closed on
Sep 16, 2013
Sold by
Tellez Federico
Bought by
Tellez Olivia
Purchase Details
Closed on
Jun 29, 1995
Sold by
Nieman Donald N and Nieman Kathleen M
Bought by
Tellez Federico and Tellez Olivia
Home Financials for this Owner
Home Financials are based on the most recent Mortgage that was taken out on this home.
Original Mortgage
$200,000
Interest Rate
7.71%
Mortgage Type
Assumption
Create a Home Valuation Report for This Property
The Home Valuation Report is an in-depth analysis detailing your home's value as well as a comparison with similar homes in the area
Home Values in the Area
Average Home Value in this Area
Purchase History
| Date | Buyer | Sale Price | Title Company |
|---|---|---|---|
| Tellez Olivia | -- | Wfg Title Company | |
| Tellez Olivia | -- | None Available | |
| Tellez Federico | $200,000 | Investors Title Company |
Source: Public Records
Mortgage History
| Date | Status | Borrower | Loan Amount |
|---|---|---|---|
| Open | Tellez Olivia | $100,100 | |
| Previous Owner | Tellez Federico | $200,000 |
Source: Public Records
Tax History
| Year | Tax Paid | Tax Assessment Tax Assessment Total Assessment is a certain percentage of the fair market value that is determined by local assessors to be the total taxable value of land and additions on the property. | Land | Improvement |
|---|---|---|---|---|
| 2025 | $3,430 | $338,270 | $182,479 | $155,791 |
| 2024 | $3,430 | $331,638 | $178,901 | $152,737 |
| 2023 | $3,350 | $325,136 | $175,393 | $149,743 |
| 2022 | $3,290 | $318,761 | $171,954 | $146,807 |
| 2021 | $3,225 | $312,511 | $168,582 | $143,929 |
| 2020 | $3,196 | $309,307 | $166,853 | $142,454 |
| 2019 | $3,132 | $303,243 | $163,582 | $139,661 |
| 2018 | $3,074 | $297,298 | $160,375 | $136,923 |
| 2017 | $3,013 | $291,469 | $157,230 | $134,239 |
| 2016 | $2,963 | $285,754 | $154,147 | $131,607 |
| 2015 | $2,927 | $281,462 | $151,831 | $129,631 |
| 2014 | $2,791 | $275,949 | $148,857 | $127,092 |
Source: Public Records
Map
Nearby Homes
- 2122 Ronda Granada Unit Q
- 2122 Ronda Granada Unit P
- 2148 Ronda Granada Unit A
- 2121 Ronda Granada Unit N
- 2091 Ronda Granada Unit D
- 2153 Ronda Granada Unit A
- 2123 Ronda Granada Unit A
- 2123 Ronda Granada Unit G
- 2133 Via Puerta
- 2111 Via Puerta Unit T
- 2104 Ronda Granada Unit A
- 2103 Ronda Granada Unit B
- 2139 Ronda Granada Unit B
- 2137 Ronda Granada Unit A
- 2082 Ronda Granada Unit D
- 2107 Ronda Granada
- 2119 Via Puerta Unit Q
- 2119 Via Puerta Unit N
- 2119 Via Puerta
- 2118 Via Puerta
- 23662 Dune Mear Rd
- 23676 Dune Mear Rd
- 23652 Dune Mear Rd
- 23682 Dune Mear Rd
- 23701 Cavanaugh Rd
- 23691 Cavanaugh Rd
- 23711 Cavanaugh Rd
- 23642 Dune Mear Rd
- 23692 Dune Mear Rd
- 23671 Dune Mear Rd
- 23721 Cavanaugh Rd
- 23681 Dune Mear Rd
- 23651 Dune Mear Rd
- 23671 Cavanaugh Rd
- 23691 Dune Mear Rd
- 23731 Cavanaugh Rd
- 23632 Dune Mear Rd
- 23641 Dune Mear Rd
- 23702 Dune Mear Rd
- 23661 Cavanaugh Rd
Your Personal Tour Guide
Ask me questions while you tour the home.