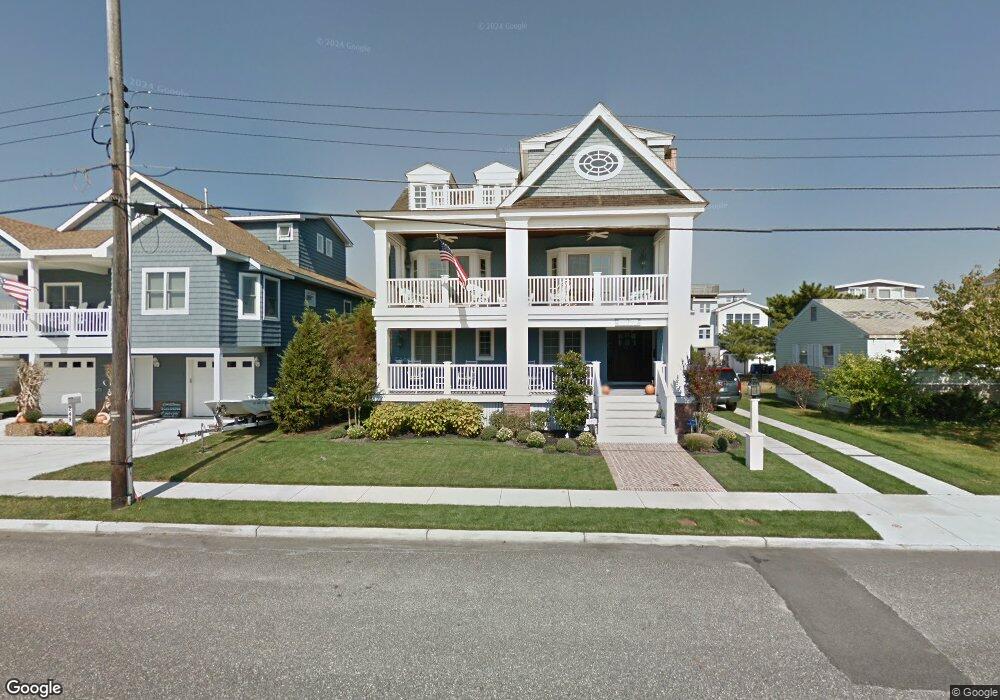
237 49th St Avalon, NJ 08202
Estimated Value: $3,982,000 - $4,533,424
Studio
--
Bath
3,974
Sq Ft
$1,093/Sq Ft
Est. Value
About This Home
This home is located at 237 49th St, Avalon, NJ 08202 and is currently estimated at $4,345,356, approximately $1,093 per square foot. 237 49th St is a home located in Cape May County with nearby schools including Avalon Elementary School.
Ownership History
Date
Name
Owned For
Owner Type
Purchase Details
Closed on
Jul 24, 2009
Sold by
Wensel Joan
Bought by
Wensel Joan and Wensel Kenneth M
Current Estimated Value
Home Financials for this Owner
Home Financials are based on the most recent Mortgage that was taken out on this home.
Original Mortgage
$1,200,000
Outstanding Balance
$810,128
Interest Rate
5.37%
Mortgage Type
New Conventional
Estimated Equity
$3,535,228
Purchase Details
Closed on
Mar 27, 2001
Sold by
Cooney Marie M
Bought by
Wensel Joan
Home Financials for this Owner
Home Financials are based on the most recent Mortgage that was taken out on this home.
Original Mortgage
$132,160
Interest Rate
6.96%
Create a Home Valuation Report for This Property
The Home Valuation Report is an in-depth analysis detailing your home's value as well as a comparison with similar homes in the area
Home Values in the Area
Average Home Value in this Area
Purchase History
| Date | Buyer | Sale Price | Title Company |
|---|---|---|---|
| Wensel Joan | -- | Freedom Title & Abstract Com | |
| Wensel Joan | $132,160 | -- |
Source: Public Records
Mortgage History
| Date | Status | Borrower | Loan Amount |
|---|---|---|---|
| Open | Wensel Joan | $1,200,000 | |
| Closed | Wensel Joan | $132,160 |
Source: Public Records
Tax History
| Year | Tax Paid | Tax Assessment Tax Assessment Total Assessment is a certain percentage of the fair market value that is determined by local assessors to be the total taxable value of land and additions on the property. | Land | Improvement |
|---|---|---|---|---|
| 2025 | $12,356 | $2,012,400 | $900,000 | $1,112,400 |
| 2024 | $12,356 | $2,012,400 | $900,000 | $1,112,400 |
| 2023 | $12,256 | $2,012,400 | $900,000 | $1,112,400 |
| 2022 | $11,430 | $2,012,400 | $900,000 | $1,112,400 |
| 2021 | $11,008 | $2,012,400 | $900,000 | $1,112,400 |
| 2020 | $10,585 | $2,012,400 | $900,000 | $1,112,400 |
| 2019 | $10,263 | $2,012,400 | $900,000 | $1,112,400 |
| 2018 | $9,821 | $2,012,400 | $900,000 | $1,112,400 |
| 2017 | $9,576 | $1,722,300 | $720,000 | $1,002,300 |
| 2016 | $9,473 | $1,722,300 | $720,000 | $1,002,300 |
| 2015 | $9,318 | $1,722,300 | $720,000 | $1,002,300 |
| 2014 | $9,214 | $1,722,300 | $720,000 | $1,002,300 |
Source: Public Records
Map
Nearby Homes
Your Personal Tour Guide
Ask me questions while you tour the home.