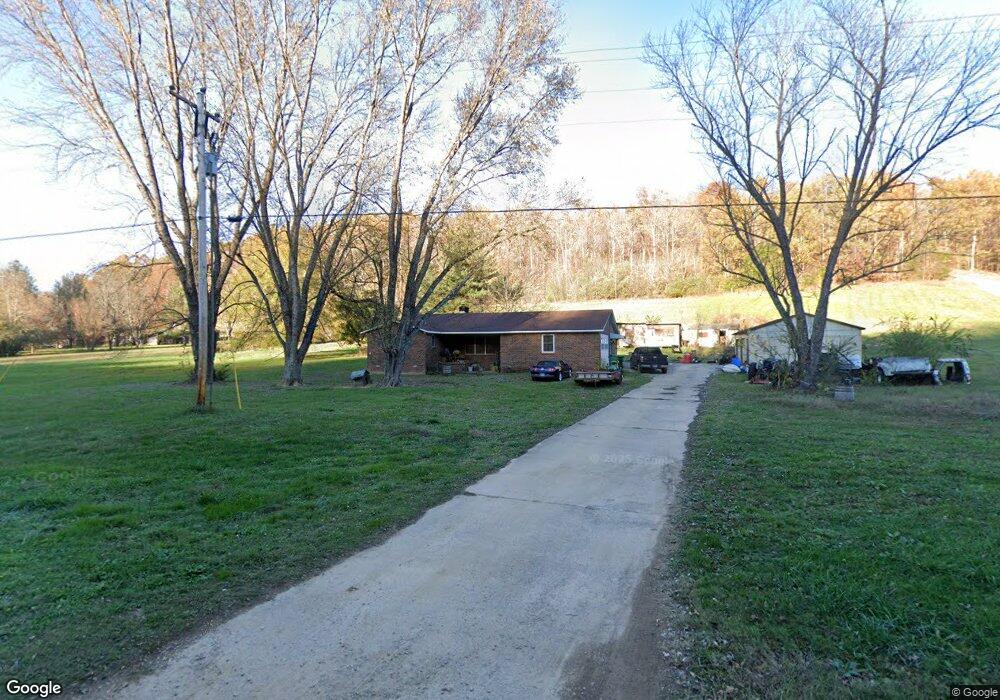
237 Cascade Hollow Rd Normandy, TN 37360
Estimated Value: $327,205 - $510,000
Studio
2
Baths
2,171
Sq Ft
$203/Sq Ft
Est. Value
About This Home
This home is located at 237 Cascade Hollow Rd, Normandy, TN 37360 and is currently estimated at $440,301, approximately $202 per square foot. 237 Cascade Hollow Rd is a home located in Bedford County with nearby schools including Cascade Elementary School, Cascade Middle School, and Cascade High School.
Ownership History
Date
Name
Owned For
Owner Type
Purchase Details
Closed on
Jan 4, 2024
Sold by
Anderson Trudy Daye
Bought by
Anderson Jonathan Tyler and Anderson Trudy Daye
Current Estimated Value
Home Financials for this Owner
Home Financials are based on the most recent Mortgage that was taken out on this home.
Original Mortgage
$84,500
Outstanding Balance
$83,020
Interest Rate
7.22%
Mortgage Type
New Conventional
Estimated Equity
$357,281
Purchase Details
Closed on
Aug 22, 2008
Sold by
Anderson Jimmy D
Bought by
Anderson Jimmy D
Purchase Details
Closed on
Jul 6, 2001
Bought by
Anderson Jimmy D
Purchase Details
Closed on
Jan 6, 2000
Bought by
Watkins Mary
Purchase Details
Closed on
Feb 5, 1997
Sold by
Minor Johnny K
Bought by
Anderson Jimmy R
Purchase Details
Closed on
Apr 20, 1984
Bought by
Minor Johnny K and Minor Renda
Purchase Details
Closed on
May 5, 1977
Bought by
Minor Johnny K and Minor Renda
Create a Home Valuation Report for This Property
The Home Valuation Report is an in-depth analysis detailing your home's value as well as a comparison with similar homes in the area
Purchase History
| Date | Buyer | Sale Price | Title Company |
|---|---|---|---|
| Anderson Jonathan Tyler | -- | Encore Title | |
| Anderson Jimmy D | -- | -- | |
| Anderson Jimmy D | $172,900 | -- | |
| Watkins Mary | $20,000 | -- | |
| Anderson Jimmy R | $110,000 | -- | |
| Minor Johnny K | -- | -- | |
| Minor Johnny K | -- | -- |
Source: Public Records
Mortgage History
| Date | Status | Borrower | Loan Amount |
|---|---|---|---|
| Open | Anderson Jonathan Tyler | $84,500 |
Source: Public Records
Tax History
| Year | Tax Paid | Tax Assessment Tax Assessment Total Assessment is a certain percentage of the fair market value that is determined by local assessors to be the total taxable value of land and additions on the property. | Land | Improvement |
|---|---|---|---|---|
| 2025 | $1,423 | $61,200 | $12,150 | $49,050 |
| 2024 | $1,423 | $61,200 | $12,150 | $49,050 |
| 2023 | $1,420 | $61,075 | $12,150 | $48,925 |
| 2022 | $1,420 | $61,075 | $12,150 | $48,925 |
| 2021 | $1,200 | $61,075 | $12,150 | $48,925 |
| 2020 | $1,020 | $61,075 | $12,150 | $48,925 |
| 2019 | $1,020 | $38,350 | $9,500 | $28,850 |
| 2018 | $982 | $38,350 | $9,500 | $28,850 |
| 2017 | $982 | $38,350 | $9,500 | $28,850 |
| 2016 | $966 | $38,350 | $9,500 | $28,850 |
| 2015 | $966 | $38,350 | $9,500 | $28,850 |
| 2014 | $911 | $40,137 | $0 | $0 |
Source: Public Records
Map
Nearby Homes
- 0 Grand View Cir Unit 33
- 0 Cascade Hollow Rd
- 4B Normandy Rd
- 2 Normandy Rd
- 4 Normandy Rd
- 308 Grand View Cir
- 0 Lakeview Rd
- 351 Rippy Ridge Rd
- 0 Carr Creek Rd
- 4104 Riley Creek Rd
- 2916 Riley Creek Rd
- 2860 Riley Creek Rd
- 4214 Riley Creek Rd
- 22 Ghea Rd
- 44 Ghea Rd
- 4140 Riley Creek Rd
- 0 Red Hill Rd
- 40 Sarvis Ridge Rd
- 555 Ghea Rd
- 431 Ovoca Lake Rd
- 207 Cascade Hollow Rd
- 201 Cascade Hollow Rd
- 261 Cascade Hollow Rd
- 231 Cascade Hollow Rd
- 0 Grand View Cir Unit 1889671
- 0 Grand View Cir Unit 1840169
- 0 Grand View Cir Unit 1719761
- 0 Grand View Cir Unit RTC2315314
- 0 Grand View Cir Unit RTC2289763
- 225 Cascade Hollow Rd
- 292 Cascade Hollow Rd
- 219 Cascade Hollow Rd
- 287 Cascade Hollow Rd
- 394 Cascade Hollow Rd
- 394 Cascade Hollow Rd
- 109 Cascade Hollow Rd
- 6 E Unit Maple St
- 0 S of College St Unit 1629988
- 269 White Eagle Tr
- 2232 Cascade Hollow Rd
Your Personal Tour Guide
Ask me questions while you tour the home.