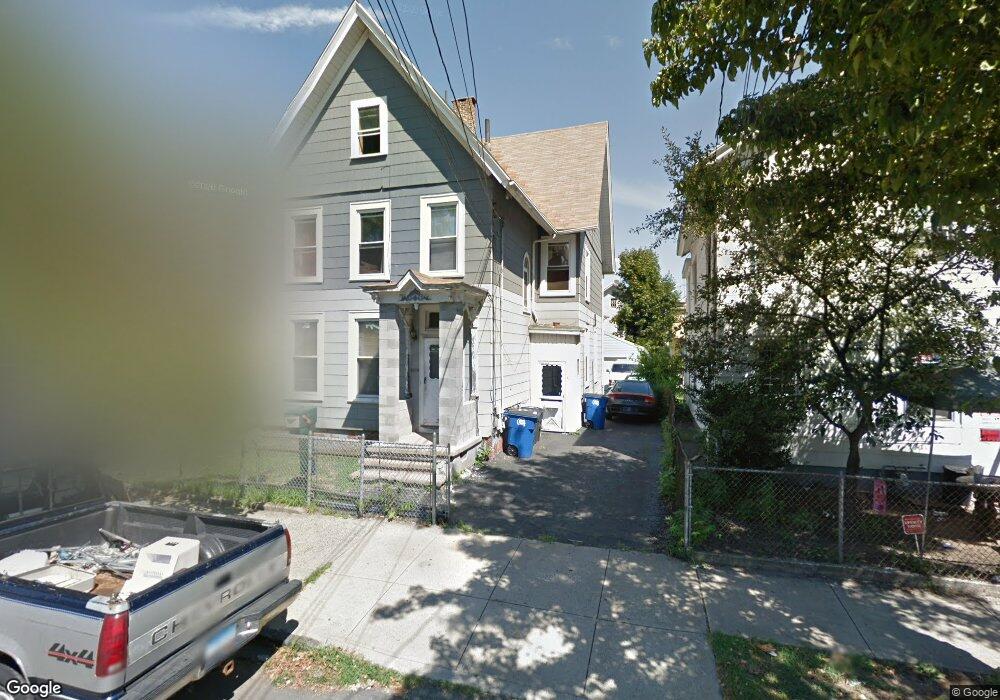
237 Exchange St New Haven, CT 06513
Fair Haven NeighborhoodEstimated Value: $323,557 - $435,000
4
Beds
2
Baths
3,008
Sq Ft
$125/Sq Ft
Est. Value
About This Home
This home is located at 237 Exchange St, New Haven, CT 06513 and is currently estimated at $376,389, approximately $125 per square foot. 237 Exchange St is a home located in New Haven County with nearby schools including Clinton Avenue School, Elm City College Preparatory School, and Cold Spring School.
Ownership History
Date
Name
Owned For
Owner Type
Purchase Details
Closed on
Dec 22, 2024
Sold by
Lopez Maria
Bought by
Segui Betsy and Segui Maribel
Current Estimated Value
Purchase Details
Closed on
Nov 4, 1996
Sold by
Novicki Eugene B and Novicki Edward J
Bought by
Lopez Maria
Home Financials for this Owner
Home Financials are based on the most recent Mortgage that was taken out on this home.
Original Mortgage
$58,950
Interest Rate
8.07%
Mortgage Type
Unknown
Create a Home Valuation Report for This Property
The Home Valuation Report is an in-depth analysis detailing your home's value as well as a comparison with similar homes in the area
Home Values in the Area
Average Home Value in this Area
Purchase History
| Date | Buyer | Sale Price | Title Company |
|---|---|---|---|
| Segui Betsy | -- | None Available | |
| Segui Betsy | -- | None Available | |
| Lopez Maria | $59,500 | -- | |
| Lopez Maria | $59,500 | -- |
Source: Public Records
Mortgage History
| Date | Status | Borrower | Loan Amount |
|---|---|---|---|
| Previous Owner | Lopez Maria | $33,800 | |
| Previous Owner | Lopez Maria | $58,950 |
Source: Public Records
Tax History
| Year | Tax Paid | Tax Assessment Tax Assessment Total Assessment is a certain percentage of the fair market value that is determined by local assessors to be the total taxable value of land and additions on the property. | Land | Improvement |
|---|---|---|---|---|
| 2025 | $5,855 | $148,610 | $40,250 | $108,360 |
| 2024 | $5,721 | $148,610 | $40,250 | $108,360 |
| 2023 | $5,528 | $148,610 | $40,250 | $108,360 |
| 2022 | $5,907 | $148,610 | $40,250 | $108,360 |
| 2021 | $3,981 | $90,720 | $32,270 | $58,450 |
| 2020 | $3,981 | $90,720 | $32,270 | $58,450 |
| 2019 | $3,899 | $90,720 | $32,270 | $58,450 |
| 2018 | $3,899 | $90,720 | $32,270 | $58,450 |
| 2017 | $3,509 | $90,720 | $32,270 | $58,450 |
| 2016 | $2,626 | $63,210 | $14,630 | $48,580 |
| 2015 | $2,626 | $63,210 | $14,630 | $48,580 |
| 2014 | $2,626 | $63,210 | $14,630 | $48,580 |
Source: Public Records
Map
Nearby Homes
- 35 Saltonstall Ave
- 56 Woolsey St
- 114 Blatchley Ave
- 111 Chapel St
- 72 Pierpont St
- 191 Ferry St
- 39 Houston St
- 127 James St
- 169 James St
- 33 Chapel St
- 181 James St
- 213 Saltonstall Ave
- 83 James St
- 1 Front St Unit 1 Kel
- 2 Front St Unit 2J
- 369 Poplar St
- 265 James St
- 100 Front St Unit 100
- 121 Fillmore St
- 95 Haven St
Your Personal Tour Guide
Ask me questions while you tour the home.