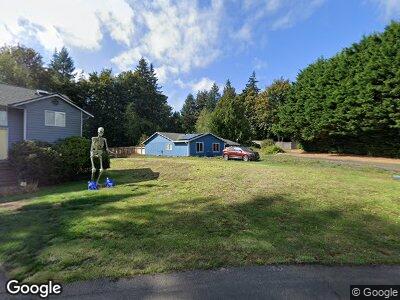
237 Fern Meadows Loop SE Port Orchard, WA 98366
Estimated Value: $580,000 - $644,000
3
Beds
3
Baths
2,112
Sq Ft
$291/Sq Ft
Est. Value
About This Home
This home is located at 237 Fern Meadows Loop SE, Port Orchard, WA 98366 and is currently estimated at $613,929, approximately $290 per square foot. 237 Fern Meadows Loop SE is a home located in Kitsap County with nearby schools including Orchard Heights Elementary School, Marcus Whitman Middle School, and South Kitsap High School.
Ownership History
Date
Name
Owned For
Owner Type
Purchase Details
Closed on
Oct 26, 2015
Sold by
Dumas Corene
Bought by
Poole Robin
Current Estimated Value
Home Financials for this Owner
Home Financials are based on the most recent Mortgage that was taken out on this home.
Original Mortgage
$202,500
Outstanding Balance
$162,725
Interest Rate
3.87%
Mortgage Type
New Conventional
Estimated Equity
$457,789
Purchase Details
Closed on
Aug 22, 2005
Sold by
Short Anthony E and Short Malinda K
Bought by
Dumas Corene C
Home Financials for this Owner
Home Financials are based on the most recent Mortgage that was taken out on this home.
Original Mortgage
$204,400
Interest Rate
1%
Mortgage Type
Fannie Mae Freddie Mac
Purchase Details
Closed on
Feb 20, 2004
Sold by
Reid Realty Inc
Bought by
Short Anthony E and Short Malinda K
Home Financials for this Owner
Home Financials are based on the most recent Mortgage that was taken out on this home.
Original Mortgage
$155,900
Interest Rate
5.62%
Mortgage Type
Construction
Create a Home Valuation Report for This Property
The Home Valuation Report is an in-depth analysis detailing your home's value as well as a comparison with similar homes in the area
Home Values in the Area
Average Home Value in this Area
Purchase History
| Date | Buyer | Sale Price | Title Company |
|---|---|---|---|
| Poole Robin | $270,000 | Fidelity Natl Title Co Wa In | |
| Dumas Corene C | $255,780 | Stewart Title Of Kitsap | |
| Short Anthony E | $32,000 | Land Title Company |
Source: Public Records
Mortgage History
| Date | Status | Borrower | Loan Amount |
|---|---|---|---|
| Open | Poole Robin | $202,500 | |
| Previous Owner | Dumas Corene C | $274,200 | |
| Previous Owner | Dumas Corene C | $270,000 | |
| Previous Owner | Dumas Corene C | $251,250 | |
| Previous Owner | Dumas Corene C | $204,400 | |
| Previous Owner | Short Anthony E | $155,900 | |
| Closed | Short Anthony E | $32,000 |
Source: Public Records
Tax History Compared to Growth
Tax History
| Year | Tax Paid | Tax Assessment Tax Assessment Total Assessment is a certain percentage of the fair market value that is determined by local assessors to be the total taxable value of land and additions on the property. | Land | Improvement |
|---|---|---|---|---|
| 2025 | $4,704 | $550,690 | $86,640 | $464,050 |
| 2024 | $4,559 | $550,690 | $86,640 | $464,050 |
| 2023 | $4,527 | $550,690 | $86,640 | $464,050 |
| 2022 | $4,329 | $440,690 | $69,450 | $371,240 |
| 2021 | $4,143 | $399,410 | $66,140 | $333,270 |
| 2020 | $4,026 | $377,320 | $58,750 | $318,570 |
| 2019 | $3,451 | $356,470 | $55,400 | $301,070 |
| 2018 | $3,608 | $279,450 | $50,150 | $229,300 |
| 2017 | $2,979 | $279,450 | $50,150 | $229,300 |
| 2016 | $3,101 | $266,560 | $47,760 | $218,800 |
| 2015 | $2,842 | $247,310 | $47,760 | $199,550 |
| 2014 | -- | $258,910 | $53,980 | $204,930 |
| 2013 | -- | $258,910 | $53,980 | $204,930 |
Source: Public Records
Map
Nearby Homes
- 884 Cherub Place E
- 1560 Woodridge Dr SE
- 1359 Marlin Dr SE
- 1330 Marlin Dr SE
- 1000 Hillandale Dr E
- 691 SE Olga Cir
- 1200 Baby Doll Rd E
- 3930 SE Mile Hill Dr
- 1350 Holmes Ave SE
- 3900 SE Mile Hill Dr
- 2240 Ponderosa Dr SE
- 3799 SE Horstman Rd
- 1978 Kelowna Place Southest
- 1050 Woods Rd E
- 5957 E Collins Rd
- 3299 Madrona Dr SE
- 6551 SE Garfield St
- 2541 Red Spruce Dr SE
- 2457 White Cedar Dr SE
- 6909 SE Cleveland Ave
- 237 Fern Meadows Loop SE
- 231 Fern Meadows Loop SE
- 243 Fern Meadows Loop SE
- 249 Fern Meadows Loop SE
- 255 Fern Meadows Loop SE
- 225 Fern Meadows Loop SE
- 261 Fern Meadows Loop SE
- 230 Fern Meadows Loop SE
- 214 Fern Meadows Loop SE
- 219 Fern Meadows Loop SE
- 5150 SE Foss Rd
- 266 Fern Meadows Loop SE
- 267 Fern Meadows Loop SE
- 1428 Saddle Club Rd SE
- 1456 Saddle Club Rd SE
- 206 Fern Meadows Loop SE
- 213 Fern Meadows Loop SE
- 1265 Baby Doll Rd SE
- 5075 SE Mile Hill Dr