237 Libbey St Hampton, VA 23663
Phoebus NeighborhoodEstimated Value: $206,000 - $216,000
3
Beds
1
Bath
988
Sq Ft
$213/Sq Ft
Est. Value
About This Home
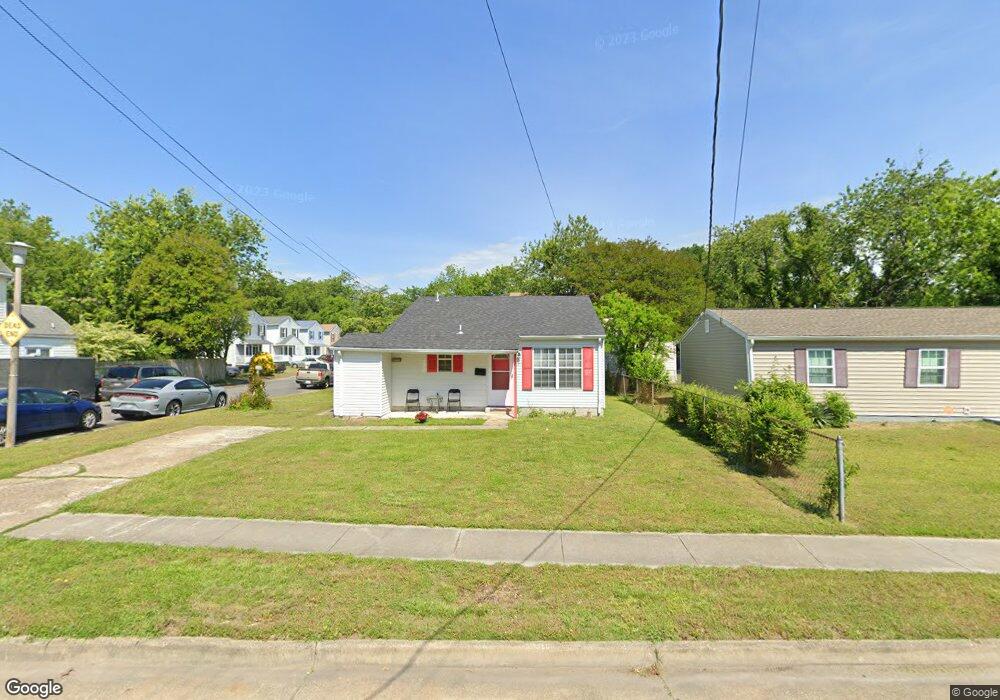
This home is located at 237 Libbey St, Hampton, VA 23663 and is currently estimated at $210,190, approximately $212 per square foot. 237 Libbey St is a home located in Hampton City with nearby schools including Jane H. Bryan Elementary School, C. Alton Lindsay Middle School, and Phoebus High School.
Ownership History
Date
Name
Owned For
Owner Type
Purchase Details
Closed on
Sep 13, 2006
Sold by
Sessoms Eric T
Bought by
Carter Scott E
Current Estimated Value
Home Financials for this Owner
Home Financials are based on the most recent Mortgage that was taken out on this home.
Original Mortgage
$130,000
Outstanding Balance
$77,430
Interest Rate
6.52%
Mortgage Type
New Conventional
Estimated Equity
$132,760
Create a Home Valuation Report for This Property
The Home Valuation Report is an in-depth analysis detailing your home's value as well as a comparison with similar homes in the area
Home Values in the Area
Average Home Value in this Area
Purchase History
| Date | Buyer | Sale Price | Title Company |
|---|---|---|---|
| Carter Scott E | $130,000 | -- |
Source: Public Records
Mortgage History
| Date | Status | Borrower | Loan Amount |
|---|---|---|---|
| Open | Carter Scott E | $130,000 |
Source: Public Records
Tax History
| Year | Tax Paid | Tax Assessment Tax Assessment Total Assessment is a certain percentage of the fair market value that is determined by local assessors to be the total taxable value of land and additions on the property. | Land | Improvement |
|---|---|---|---|---|
| 2025 | $2,202 | $195,600 | $55,000 | $140,600 |
| 2024 | $1,878 | $163,300 | $55,000 | $108,300 |
| 2023 | $1,740 | $150,000 | $55,000 | $95,000 |
| 2022 | $1,711 | $145,000 | $50,000 | $95,000 |
| 2021 | $1,582 | $117,100 | $29,400 | $87,700 |
| 2020 | $1,441 | $116,200 | $29,400 | $86,800 |
| 2019 | $1,441 | $116,200 | $29,400 | $86,800 |
| 2018 | $1,524 | $115,300 | $29,400 | $85,900 |
| 2017 | $1,524 | $0 | $0 | $0 |
| 2016 | $1,524 | $115,300 | $0 | $0 |
| 2015 | $1,524 | $0 | $0 | $0 |
| 2014 | $1,514 | $115,300 | $29,400 | $85,900 |
Source: Public Records
Map
Nearby Homes
- 26 Booker St
- 22 Booker St
- 10 Booker St
- 68 W County St
- 25 W Cummings Ave
- 106 W Cummings Ave
- 306 N Mallory St
- 106 E Cummings Ave
- 109 E Cummings Ave
- 29 Taylor Ave E
- 109 Frissell St
- 112 W Kelly Ave
- 116 W Kelly Ave
- 509 N Mallory St
- 221 S Hope St
- 54 W Virginia Ave
- 120 E Kelly Ave
- 122 E Kelly Ave
- 26 Downes St
- 308 S Hope St
Your Personal Tour Guide
Ask me questions while you tour the home.