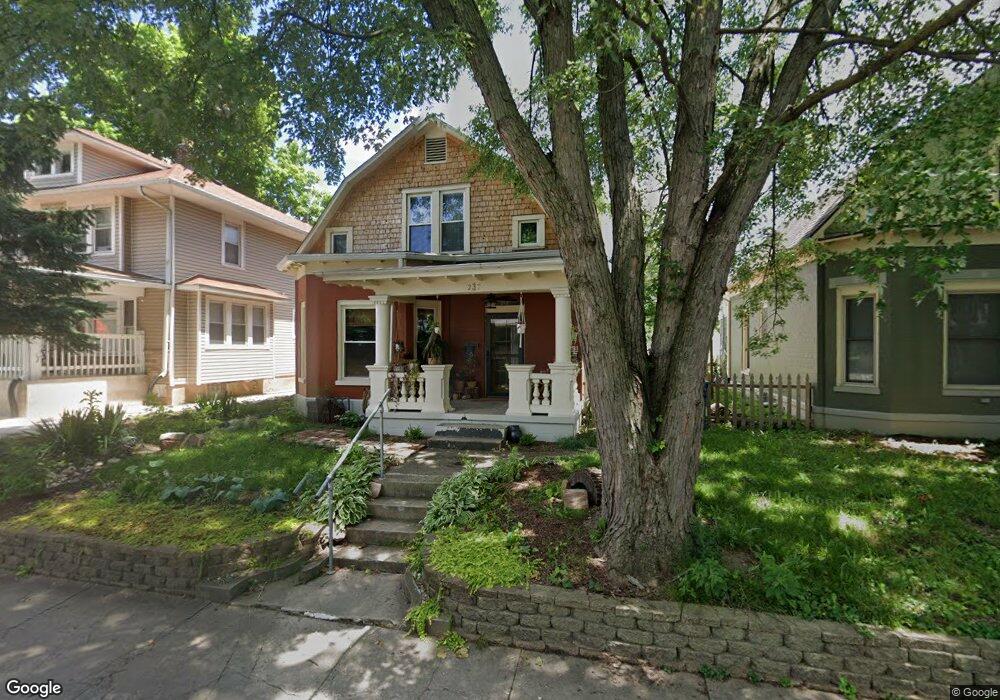
237 N Gray St Indianapolis, IN 46201
Near Eastside NeighborhoodEstimated Value: $168,000 - $246,000
2
Beds
1
Bath
1,492
Sq Ft
$132/Sq Ft
Est. Value
About This Home
This home is located at 237 N Gray St, Indianapolis, IN 46201 and is currently estimated at $197,228, approximately $132 per square foot. 237 N Gray St is a home located in Marion County with nearby schools including Ralph Waldo Emerson School 58, William McKinley School 39, and Eleanor Skillen School No. 34.
Ownership History
Date
Name
Owned For
Owner Type
Purchase Details
Closed on
Apr 10, 2023
Sold by
Englewood Community Development Corporat
Bought by
Selby Tyler C and Selby Katie J
Current Estimated Value
Home Financials for this Owner
Home Financials are based on the most recent Mortgage that was taken out on this home.
Original Mortgage
$7,500
Outstanding Balance
$7,279
Interest Rate
6.27%
Estimated Equity
$189,949
Purchase Details
Closed on
Mar 21, 2014
Sold by
Marion County Auditor
Bought by
Marion County
Purchase Details
Closed on
Mar 20, 2014
Sold by
Jones Christopher
Bought by
County Of Marion
Purchase Details
Closed on
Nov 29, 2006
Sold by
American General Financial Services Inc
Bought by
Jones Christopher
Purchase Details
Closed on
Jun 1, 2006
Sold by
Coleman Gregory H and Eq Financial Inc
Bought by
American General Finance Inc
Create a Home Valuation Report for This Property
The Home Valuation Report is an in-depth analysis detailing your home's value as well as a comparison with similar homes in the area
Home Values in the Area
Average Home Value in this Area
Purchase History
| Date | Buyer | Sale Price | Title Company |
|---|---|---|---|
| Selby Tyler C | $165,000 | First American Title | |
| Marion County | $10,000 | -- | |
| Englewood Community Development Corporat | $10,000 | None Available | |
| County Of Marion | $4,655 | None Available | |
| Jones Christopher | -- | None Available | |
| American General Finance Inc | -- | None Available |
Source: Public Records
Mortgage History
| Date | Status | Borrower | Loan Amount |
|---|---|---|---|
| Open | Selby Tyler C | $7,500 | |
| Open | Selby Tyler C | $161,400 |
Source: Public Records
Tax History Compared to Growth
Tax History
| Year | Tax Paid | Tax Assessment Tax Assessment Total Assessment is a certain percentage of the fair market value that is determined by local assessors to be the total taxable value of land and additions on the property. | Land | Improvement |
|---|---|---|---|---|
| 2024 | $88 | $179,500 | $12,200 | $167,300 |
| 2023 | $88 | $56,400 | $12,200 | $44,200 |
| 2022 | $86 | $55,700 | $12,200 | $43,500 |
| 2021 | $1,088 | $43,500 | $12,200 | $31,300 |
| 2020 | $1,609 | $31,800 | $2,300 | $29,500 |
| 2019 | $779 | $29,600 | $2,300 | $27,300 |
| 2018 | $696 | $25,900 | $2,300 | $23,600 |
| 2017 | $604 | $24,800 | $2,300 | $22,500 |
| 2016 | $502 | $22,600 | $2,300 | $20,300 |
| 2014 | $497 | $22,800 | $2,300 | $20,500 |
| 2013 | $497 | $23,900 | $2,300 | $21,600 |
Source: Public Records
Map
Nearby Homes
- 33 N Gray St
- 3036 E New York St
- 309 N Lasalle St
- 3920 E Washington St
- 419 N Dearborn St
- 3328 E New York St
- 2850 E New York St
- 304 N Oxford St
- 33 S Gray St
- 451 N Gray St
- 423 N Oxford St
- 443 N Lasalle St
- 463 N Lasalle St
- 111 N Gale St
- 67 S Dearborn St
- 518 N Oakland Ave
- 526 N Lasalle St
- 530 N Dearborn St
- 435 N Rural St
- 528 N Lasalle St
- 241 N Gray St
- 233 N Gray St
- 257 N Gray St
- 229 N Gray St
- 225 N Gray St
- 84 N Dearborn St
- 80 N Dearborn St
- 88 N Dearborn St
- 253 N Gray St
- 76 N Dearborn St
- 92 N Dearborn St
- 221 N Gray St
- 72 N Dearborn St
- 3109 E New York St
- 242 N Gray St
- 234 N Gray St
- 94 N Dearborn St
- 3115 E New York St
- 3107 E New York St