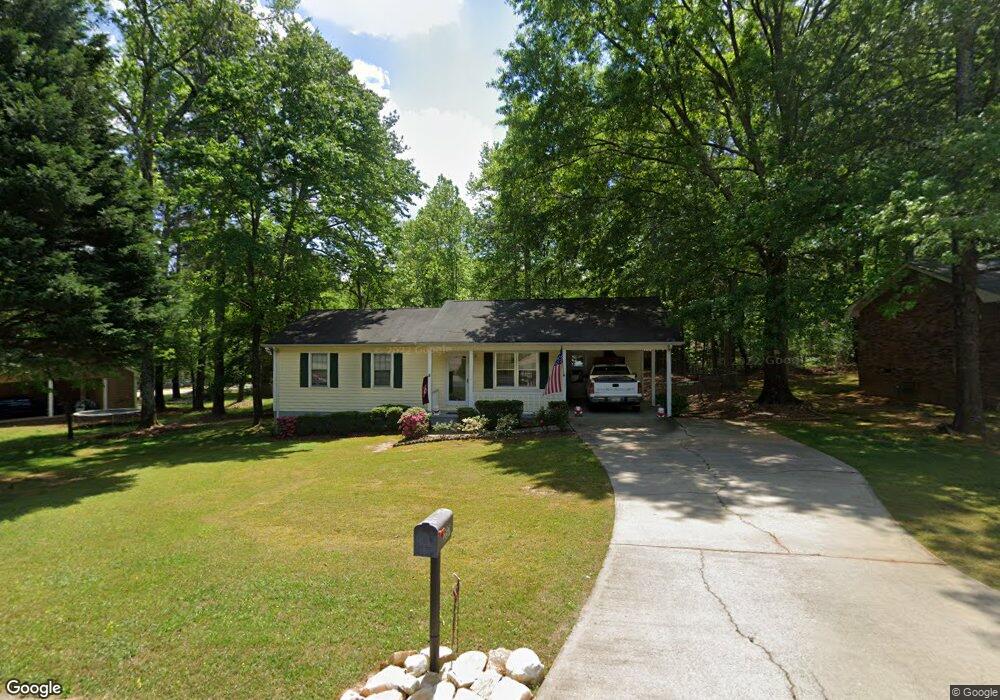
237 Rutledge Dr Winder, GA 30680
Estimated Value: $256,571 - $270,000
3
Beds
2
Baths
1,086
Sq Ft
$240/Sq Ft
Est. Value
About This Home
This home is located at 237 Rutledge Dr, Winder, GA 30680 and is currently estimated at $260,893, approximately $240 per square foot. 237 Rutledge Dr is a home located in Barrow County with nearby schools including Holsenbeck Elementary School, Bear Creek Middle School, and Winder-Barrow High School.
Ownership History
Date
Name
Owned For
Owner Type
Purchase Details
Closed on
Mar 23, 2000
Sold by
Brewer Robert M
Bought by
Fields Ronald B
Current Estimated Value
Home Financials for this Owner
Home Financials are based on the most recent Mortgage that was taken out on this home.
Original Mortgage
$75,000
Outstanding Balance
$25,565
Interest Rate
8.37%
Mortgage Type
New Conventional
Estimated Equity
$235,328
Purchase Details
Closed on
Nov 25, 1997
Sold by
Moore David G and Moore Patricia A
Bought by
Brewer Rbt M
Home Financials for this Owner
Home Financials are based on the most recent Mortgage that was taken out on this home.
Original Mortgage
$78,165
Interest Rate
7.35%
Mortgage Type
FHA
Purchase Details
Closed on
Oct 6, 1994
Sold by
Winchester Tammy A
Bought by
Moore David G and Moore Patricia A
Home Financials for this Owner
Home Financials are based on the most recent Mortgage that was taken out on this home.
Original Mortgage
$59,850
Interest Rate
8.53%
Purchase Details
Closed on
Dec 27, 1990
Bought by
Winchester Tammy A
Create a Home Valuation Report for This Property
The Home Valuation Report is an in-depth analysis detailing your home's value as well as a comparison with similar homes in the area
Home Values in the Area
Average Home Value in this Area
Purchase History
| Date | Buyer | Sale Price | Title Company |
|---|---|---|---|
| Fields Ronald B | $87,000 | -- | |
| Brewer Rbt M | $79,900 | -- | |
| Moore David G | $63,000 | -- | |
| Winchester Tammy A | $55,500 | -- |
Source: Public Records
Mortgage History
| Date | Status | Borrower | Loan Amount |
|---|---|---|---|
| Open | Fields Ronald B | $75,000 | |
| Previous Owner | Brewer Rbt M | $78,165 | |
| Previous Owner | Moore David G | $59,850 |
Source: Public Records
Tax History Compared to Growth
Tax History
| Year | Tax Paid | Tax Assessment Tax Assessment Total Assessment is a certain percentage of the fair market value that is determined by local assessors to be the total taxable value of land and additions on the property. | Land | Improvement |
|---|---|---|---|---|
| 2024 | $657 | $75,345 | $18,000 | $57,345 |
| 2023 | $1,307 | $75,345 | $18,000 | $57,345 |
| 2022 | $1,655 | $55,550 | $14,400 | $41,150 |
| 2021 | $1,385 | $44,791 | $12,000 | $32,791 |
| 2020 | $1,362 | $44,791 | $12,000 | $32,791 |
| 2019 | $1,191 | $37,012 | $8,400 | $28,612 |
| 2018 | $1,133 | $34,922 | $8,400 | $26,522 |
| 2017 | $834 | $27,962 | $7,600 | $20,362 |
| 2016 | $719 | $24,860 | $7,600 | $17,260 |
| 2015 | $727 | $25,085 | $7,600 | $17,485 |
| 2014 | $613 | $22,442 | $4,508 | $17,934 |
| 2013 | -- | $21,633 | $4,508 | $17,125 |
Source: Public Records
Map
Nearby Homes
- 235 Rutledge Dr
- 238 Doster Dr
- 241 Rutledge Dr
- 236 Doster Dr
- 233 Rutledge Dr
- 234 Doster Dr
- 236 Rutledge Dr
- 232 Doster Dr
- 0 Doster Dr Unit 7379112
- 234 Rutledge Dr
- 231 Rutledge Dr
- 243 Doster Dr
- 241 Doster Dr
- 232 Rutledge Dr
- 245 Rutledge Dr
- 230 Doster Dr
- 237 Doster Dr
- 297 Martin Luther King jr Dr
- 297 King St
- 239 Doster Dr