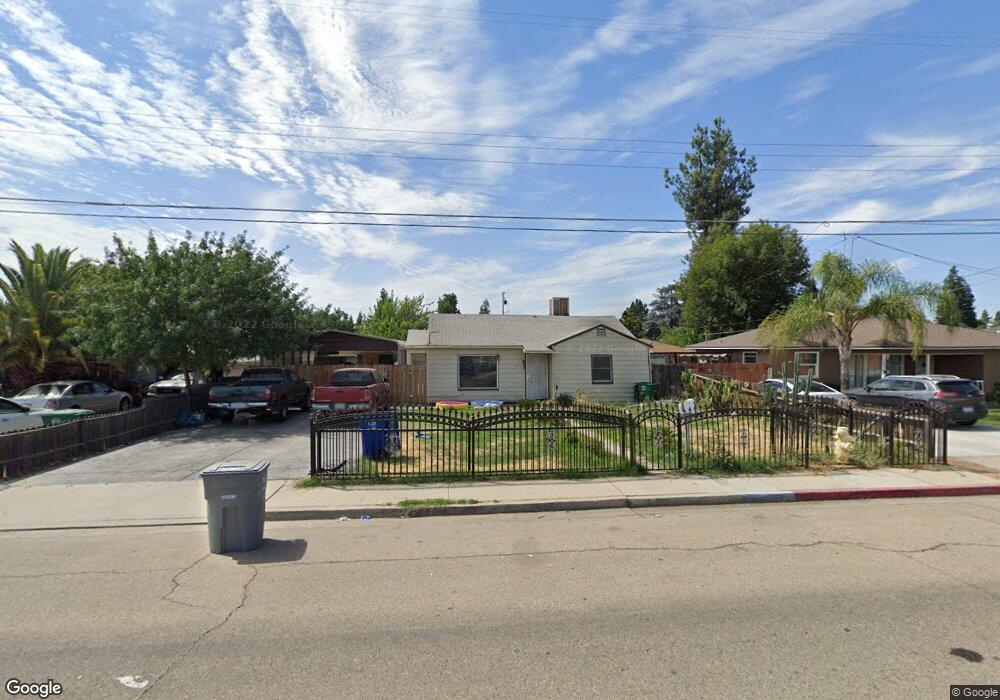
237 W Olson Ave Reedley, CA 93654
Estimated Value: $238,860 - $318,000
2
Beds
1
Bath
1,054
Sq Ft
$265/Sq Ft
Est. Value
About This Home
This home is located at 237 W Olson Ave, Reedley, CA 93654 and is currently estimated at $278,953, approximately $264 per square foot. 237 W Olson Ave is a home located in Fresno County with nearby schools including Washington Elementary School, General Grant Middle School, and Reedley High School.
Ownership History
Date
Name
Owned For
Owner Type
Purchase Details
Closed on
Oct 19, 2009
Sold by
Hsbc Bank Usa National Association
Bought by
Hernandez Juan Frausto and Hernandez Marcela Ruiz
Current Estimated Value
Home Financials for this Owner
Home Financials are based on the most recent Mortgage that was taken out on this home.
Original Mortgage
$84,640
Interest Rate
4.91%
Mortgage Type
New Conventional
Purchase Details
Closed on
May 21, 2009
Sold by
Rodriguez Jose R and Rodriguez Claudia E
Bought by
Hsbc Bank Usa National Association
Purchase Details
Closed on
Dec 7, 2005
Sold by
Reid Larry
Bought by
Rodriguez Jose R and Rodriguez Claudia E
Home Financials for this Owner
Home Financials are based on the most recent Mortgage that was taken out on this home.
Original Mortgage
$37,400
Interest Rate
6.36%
Mortgage Type
Stand Alone Second
Purchase Details
Closed on
Jul 20, 2004
Sold by
Reid Helen P
Bought by
Reid Larry
Create a Home Valuation Report for This Property
The Home Valuation Report is an in-depth analysis detailing your home's value as well as a comparison with similar homes in the area
Home Values in the Area
Average Home Value in this Area
Purchase History
| Date | Buyer | Sale Price | Title Company |
|---|---|---|---|
| Hernandez Juan Frausto | $92,000 | First American Title Company | |
| Hsbc Bank Usa National Association | $85,000 | None Available | |
| Rodriguez Jose R | $187,000 | Chicago Title Company | |
| Reid Larry | -- | -- |
Source: Public Records
Mortgage History
| Date | Status | Borrower | Loan Amount |
|---|---|---|---|
| Previous Owner | Hernandez Juan Frausto | $84,640 | |
| Previous Owner | Rodriguez Jose R | $37,400 | |
| Previous Owner | Rodriguez Jose R | $149,600 |
Source: Public Records
Tax History
| Year | Tax Paid | Tax Assessment Tax Assessment Total Assessment is a certain percentage of the fair market value that is determined by local assessors to be the total taxable value of land and additions on the property. | Land | Improvement |
|---|---|---|---|---|
| 2025 | $1,298 | $118,744 | $51,627 | $67,117 |
| 2023 | $1,267 | $114,134 | $49,623 | $64,511 |
| 2022 | $1,273 | $111,897 | $48,650 | $63,247 |
| 2021 | $1,239 | $109,704 | $47,697 | $62,007 |
| 2020 | $1,254 | $108,580 | $47,208 | $61,372 |
| 2019 | $1,213 | $106,452 | $46,283 | $60,169 |
| 2018 | $1,214 | $104,366 | $45,376 | $58,990 |
| 2017 | $1,151 | $102,321 | $44,487 | $57,834 |
| 2016 | $1,174 | $100,315 | $43,615 | $56,700 |
| 2015 | $1,128 | $98,809 | $42,960 | $55,849 |
| 2014 | $1,129 | $96,874 | $42,119 | $54,755 |
Source: Public Records
Map
Nearby Homes
- 1416 S Church Ave
- 440 E Stanley Ave
- 2087 S Church Ave
- 995 S Hope Ave
- 2222 11th St
- 2043 11th St
- 1300 W Olson Ave Unit 61
- 1300 W Olson Ave Unit 179
- 1300 W Olson Ave Unit 131
- 1055 E Dinuba Ave
- 471 S Reed Ave
- 1205 F St
- 1249 D St
- 216 S Sunset Ave
- 864 E Evening Glow Ave
- 394 S Oak Dr
- 1064 E Early Ave
- 1590 E Dinuba Ave
- 1282 W Flora Ave
- 1405 W Flora Ave
- 257 W Olson Ave
- 215 W Olson Ave
- 273 W Olson Ave
- 201 W Olson Ave
- 232 W Stanley Ave
- 254 W Stanley Ave
- 216 W Stanley Ave
- 1461 S Enns Ave
- 285 W Olson Ave
- 181 W Olson Ave
- 270 W Stanley Ave
- 198 W Stanley Ave
- 1460 S Cyrier Ave
- 292 W Stanley Ave
- 174 W Stanley Ave
- 155 W Olson Ave
- 1435 S Enns Ave
- 317 W Olson Ave
- 1459 S Birch Ave
- 1434 S Cyrier Ave
Your Personal Tour Guide
Ask me questions while you tour the home.