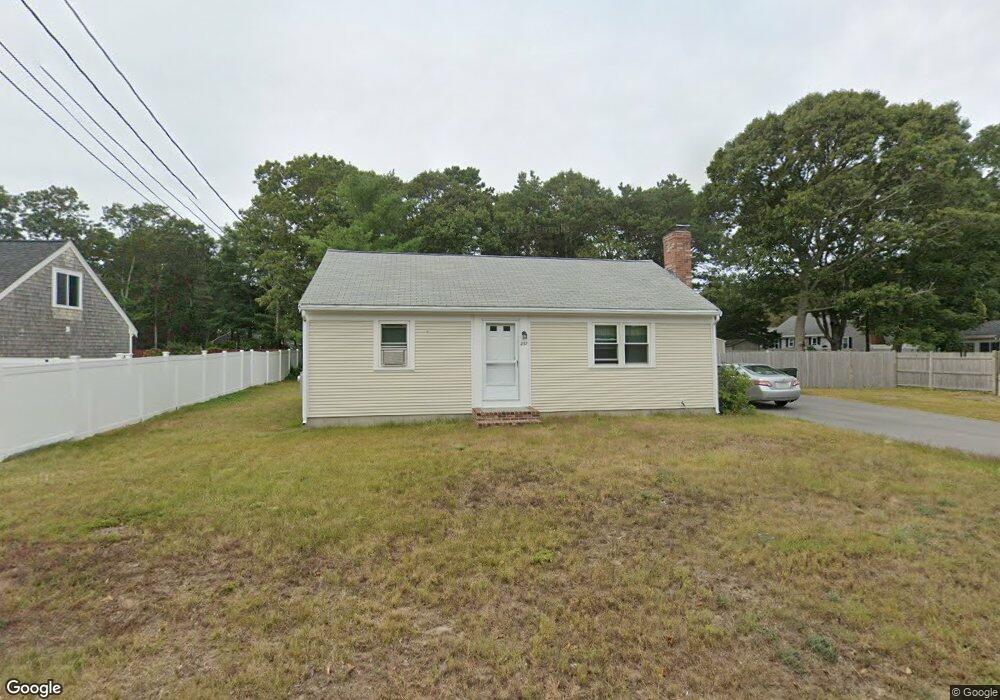
237 Wood Rd South Yarmouth, MA 02664
Estimated Value: $449,000 - $568,000
3
Beds
1
Bath
1,001
Sq Ft
$511/Sq Ft
Est. Value
About This Home
This home is located at 237 Wood Rd, South Yarmouth, MA 02664 and is currently estimated at $511,065, approximately $510 per square foot. 237 Wood Rd is a home located in Barnstable County with nearby schools including Dennis-Yarmouth Regional High School.
Ownership History
Date
Name
Owned For
Owner Type
Purchase Details
Closed on
Nov 6, 1998
Sold by
Carroll John D and Carroll Paula E
Bought by
Cisar Christopher W
Current Estimated Value
Purchase Details
Closed on
Apr 30, 1993
Sold by
Whitehead James A and Whitehead Carol L
Bought by
Carroll John D and Carroll Paula E
Home Financials for this Owner
Home Financials are based on the most recent Mortgage that was taken out on this home.
Original Mortgage
$68,000
Interest Rate
7.51%
Mortgage Type
Purchase Money Mortgage
Create a Home Valuation Report for This Property
The Home Valuation Report is an in-depth analysis detailing your home's value as well as a comparison with similar homes in the area
Home Values in the Area
Average Home Value in this Area
Purchase History
| Date | Buyer | Sale Price | Title Company |
|---|---|---|---|
| Cisar Christopher W | $105,000 | -- | |
| Carroll John D | $90,000 | -- |
Source: Public Records
Mortgage History
| Date | Status | Borrower | Loan Amount |
|---|---|---|---|
| Open | Carroll John D | $20,000 | |
| Previous Owner | Carroll John D | $68,000 | |
| Previous Owner | Carroll John D | $75,000 |
Source: Public Records
Tax History Compared to Growth
Tax History
| Year | Tax Paid | Tax Assessment Tax Assessment Total Assessment is a certain percentage of the fair market value that is determined by local assessors to be the total taxable value of land and additions on the property. | Land | Improvement |
|---|---|---|---|---|
| 2025 | $3,284 | $463,800 | $184,700 | $279,100 |
| 2024 | $3,044 | $412,500 | $156,200 | $256,300 |
| 2023 | $2,944 | $363,000 | $135,200 | $227,800 |
| 2022 | $2,790 | $303,900 | $122,900 | $181,000 |
| 2021 | $2,640 | $276,100 | $122,900 | $153,200 |
| 2020 | $2,594 | $259,400 | $122,900 | $136,500 |
| 2019 | $2,417 | $239,300 | $122,900 | $116,400 |
| 2018 | $2,275 | $221,100 | $104,700 | $116,400 |
| 2017 | $2,169 | $216,500 | $100,100 | $116,400 |
| 2016 | $2,070 | $207,400 | $91,000 | $116,400 |
| 2015 | $2,022 | $201,400 | $91,000 | $110,400 |
Source: Public Records
Map
Nearby Homes