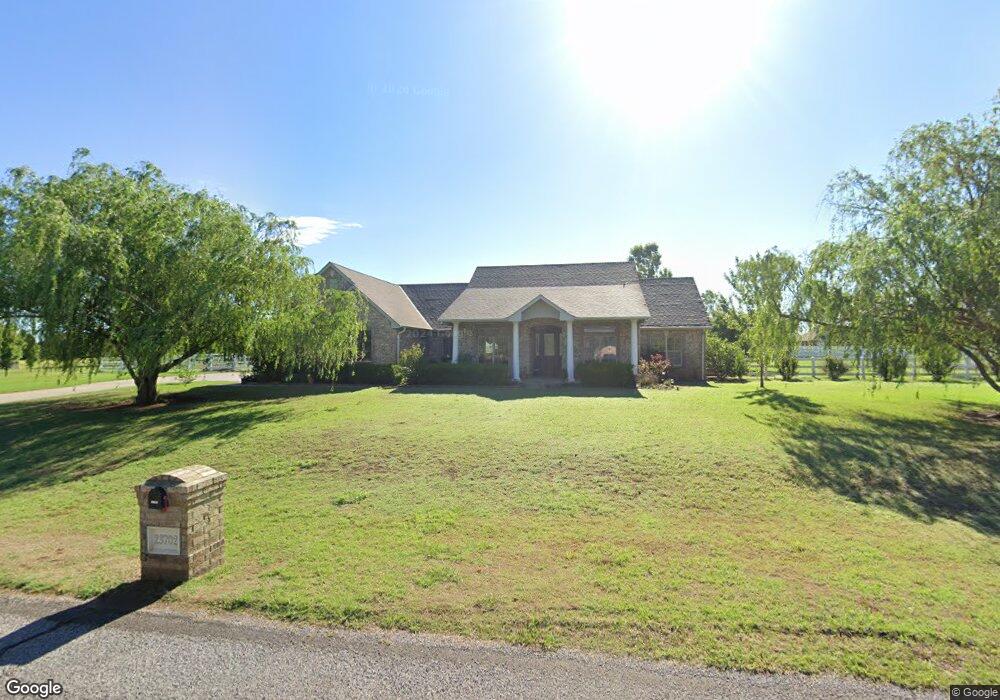
23702 Tuscany Plaza Edmond, OK 73025
West Edmond NeighborhoodEstimated Value: $449,000 - $527,000
3
Beds
3
Baths
2,686
Sq Ft
$182/Sq Ft
Est. Value
About This Home
This home is located at 23702 Tuscany Plaza, Edmond, OK 73025 and is currently estimated at $488,984, approximately $182 per square foot. 23702 Tuscany Plaza is a home located in Oklahoma County with nearby schools including Prairie Vale Elementary School, Deer Creek Middle School, and Deer Creek Intermediate School.
Ownership History
Date
Name
Owned For
Owner Type
Purchase Details
Closed on
Jul 12, 2010
Sold by
Russ Jill A and Russ Kevin S
Bought by
Bank Of Albuquerque Na
Current Estimated Value
Purchase Details
Closed on
Jun 30, 2010
Sold by
Bank Of Albuquerque Na
Bought by
Federal Home Loan Mortgage Corp
Purchase Details
Closed on
Mar 30, 2007
Sold by
Exodus 2006 Llc
Bought by
Russ Kevin S and Russ Jill A
Home Financials for this Owner
Home Financials are based on the most recent Mortgage that was taken out on this home.
Original Mortgage
$27,990
Interest Rate
6.24%
Mortgage Type
Stand Alone Second
Purchase Details
Closed on
Jan 4, 2007
Sold by
Freeman Real Estate Llc
Bought by
Exodus 2006 Llc
Purchase Details
Closed on
Nov 15, 2004
Sold by
Tuscany Development Llc
Bought by
Freeman Real Estate Llc
Create a Home Valuation Report for This Property
The Home Valuation Report is an in-depth analysis detailing your home's value as well as a comparison with similar homes in the area
Home Values in the Area
Average Home Value in this Area
Purchase History
| Date | Buyer | Sale Price | Title Company |
|---|---|---|---|
| Bank Of Albuquerque Na | $240,160 | None Available | |
| Federal Home Loan Mortgage Corp | -- | None Available | |
| Russ Kevin S | $280,000 | Capitol Abstract & Title Co | |
| Exodus 2006 Llc | $220,500 | Capitol Abstract & Title Co | |
| Freeman Real Estate Llc | $42,000 | Capitol Abstract & Title Co |
Source: Public Records
Mortgage History
| Date | Status | Borrower | Loan Amount |
|---|---|---|---|
| Previous Owner | Russ Kevin S | $27,990 | |
| Previous Owner | Russ Kevin S | $223,920 |
Source: Public Records
Tax History Compared to Growth
Tax History
| Year | Tax Paid | Tax Assessment Tax Assessment Total Assessment is a certain percentage of the fair market value that is determined by local assessors to be the total taxable value of land and additions on the property. | Land | Improvement |
|---|---|---|---|---|
| 2024 | $4,738 | $40,095 | $7,302 | $32,793 |
| 2023 | $4,738 | $38,185 | $6,962 | $31,223 |
| 2022 | $4,175 | $36,367 | $7,944 | $28,423 |
| 2021 | $3,910 | $34,635 | $8,391 | $26,244 |
| 2020 | $4,109 | $32,986 | $6,728 | $26,258 |
| 2019 | $229 | $31,416 | $7,030 | $24,386 |
| 2018 | $218 | $29,920 | $0 | $0 |
| 2017 | $221 | $30,305 | $7,348 | $22,957 |
| 2016 | $3,778 | $30,084 | $7,477 | $22,607 |
| 2015 | $3,511 | $30,435 | $7,477 | $22,958 |
| 2014 | $3,387 | $29,055 | $7,477 | $21,578 |
Source: Public Records
Map
Nearby Homes
- 2220 NW 227th St
- 2270 NW 227th St
- 22645 Forester Ln
- 2412 NW 227th St
- 0 W Waterloo Rd
- 1855 Graces Cir
- 22622 Graces Terrace
- 22301 Pine Bluff Way
- 5809 W Waterloo Rd
- 22576 Pine Bluff Way
- 4150 W Waterloo Rd
- 1720 Silver Oaks Dr
- 2300 NW 220th Terrace
- 1180 Bailey Cir
- 14550 S Pennsylvania Ave
- 2777 NW 222nd St
- 21998 Homesteaders Rd
- 14500 Meadow Ridge Ln
- 22057 Water Oak Cir
- 21930 Homesteaders Place
- 23701 Bella Vista St
- 23802 Tuscany Plaza
- 23602 Tuscany Plaza
- 23703 Tuscany Plaza
- 23801 Bella Vista St
- 23601 Bella Vista St
- 23603 Tuscany Plaza
- 23803 Tuscany Plaza
- 23601 Tuscany Plaza
- 23700 Bella Vista St
- 2205 NW 238th St
- 23800 Bella Vista St
- 23700 Casa Blanca
- 2273 NW 238th St
- 2251 NW 238th St
- 23792 Casa Blanca
- 23600 Bella Vista St
- 2160 NW 235th St
- 2155 NW 238th St
- 23610 Casa Blanca