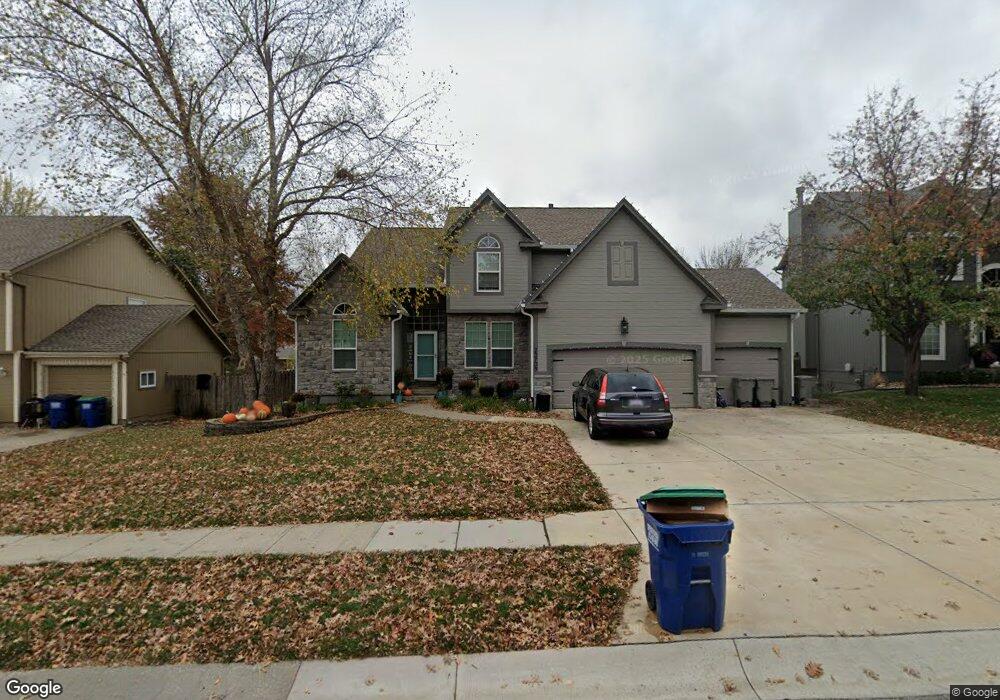
23709 W 54th Terrace Shawnee, KS 66226
Estimated Value: $442,511 - $481,000
4
Beds
3
Baths
2,343
Sq Ft
$196/Sq Ft
Est. Value
About This Home
This home is located at 23709 W 54th Terrace, Shawnee, KS 66226 and is currently estimated at $458,128, approximately $195 per square foot. 23709 W 54th Terrace is a home located in Johnson County with nearby schools including Belmont Elementary School, Mill Creek Middle School, and Mill Valley High School.
Ownership History
Date
Name
Owned For
Owner Type
Purchase Details
Closed on
Oct 17, 2020
Sold by
Kitchen Robbie J and Kitchen Beth A
Bought by
Kitchen Robbie J and Kitchen Beth A
Current Estimated Value
Purchase Details
Closed on
Apr 16, 2009
Sold by
Kitchen Robbie J and Kitchen Beth A
Bought by
Kitchen Robbie J
Home Financials for this Owner
Home Financials are based on the most recent Mortgage that was taken out on this home.
Original Mortgage
$231,990
Interest Rate
5.03%
Mortgage Type
FHA
Purchase Details
Closed on
Apr 12, 2004
Sold by
Hoelting Brothers Builders Inc
Bought by
Kitchen Robbie J and Kitchen Beth A
Home Financials for this Owner
Home Financials are based on the most recent Mortgage that was taken out on this home.
Original Mortgage
$202,000
Interest Rate
5.42%
Mortgage Type
Purchase Money Mortgage
Create a Home Valuation Report for This Property
The Home Valuation Report is an in-depth analysis detailing your home's value as well as a comparison with similar homes in the area
Home Values in the Area
Average Home Value in this Area
Purchase History
| Date | Buyer | Sale Price | Title Company |
|---|---|---|---|
| Kitchen Robbie J | -- | Accommodation | |
| Kitchen Robbie J | -- | None Listed On Document | |
| Kitchen Robbie J | -- | None Listed On Document | |
| Kitchen Robbie J | -- | Title Star Agency Llc | |
| Kitchen Robbie J | -- | Chicago Title Ins Co |
Source: Public Records
Mortgage History
| Date | Status | Borrower | Loan Amount |
|---|---|---|---|
| Previous Owner | Kitchen Robbie J | $231,990 | |
| Previous Owner | Kitchen Robbie J | $202,000 |
Source: Public Records
Tax History Compared to Growth
Tax History
| Year | Tax Paid | Tax Assessment Tax Assessment Total Assessment is a certain percentage of the fair market value that is determined by local assessors to be the total taxable value of land and additions on the property. | Land | Improvement |
|---|---|---|---|---|
| 2024 | $5,446 | $46,863 | $8,063 | $38,800 |
| 2023 | $5,221 | $44,413 | $8,063 | $36,350 |
| 2022 | $5,000 | $41,665 | $7,004 | $34,661 |
| 2021 | $4,564 | $36,547 | $6,669 | $29,878 |
| 2020 | $4,345 | $34,466 | $6,669 | $27,797 |
| 2019 | $4,247 | $33,201 | $5,549 | $27,652 |
| 2018 | $4,077 | $31,579 | $5,549 | $26,030 |
| 2017 | $4,119 | $31,131 | $5,258 | $25,873 |
| 2016 | $4,032 | $30,096 | $5,258 | $24,838 |
| 2015 | $3,967 | $29,118 | $5,258 | $23,860 |
| 2013 | -- | $27,462 | $5,264 | $22,198 |
Source: Public Records
Map
Nearby Homes
- 5625 Meadow View Dr
- 5858 Mccormick Dr
- 5221 Meadow View Dr
- The Paxton III Plan at Canyon Lakes
- The Sydney III Plan at Canyon Lakes
- The Harlow V Plan at Canyon Lakes
- The Hailey Plan at Canyon Lakes
- The Brooklyn II Plan at Canyon Lakes
- The Niko Plan at Canyon Lakes
- The Payton Plan at Canyon Lakes
- The Aspen Plan at Canyon Lakes
- The Levi II Plan at Canyon Lakes
- The Madison Plan at Canyon Lakes
- The Ellsworth Plan at Canyon Lakes
- The Dakota Plan at Canyon Lakes
- The Ashland Plan at Canyon Lakes
- The Davidson II Plan at Canyon Lakes
- 5764 Apache Dr
- 6122 Lewis Dr
- 6118 Lewis Dr
- 23705 W 54th Terrace
- 23713 W 54th Terrace
- 23611 W 54th Terrace
- 23717 W 54th Terrace
- 23708 W 54th Terrace
- 23704 W 54th Terrace
- 23714 W 54th Terrace
- 23755 W 55th St
- 23607 W 54th Terrace
- 23608 W 54th Terrace
- 23785 W 55th St
- 23805 W 54th Terrace
- 23725 W 55th St
- 23602 W 54th Terrace
- 23707 W 54th St
- 5523 Gleason Rd
- 23603 W 54th Terrace
- 23703 W 54th St
- 23695 W 55th St
- 5411 Gleason Rd