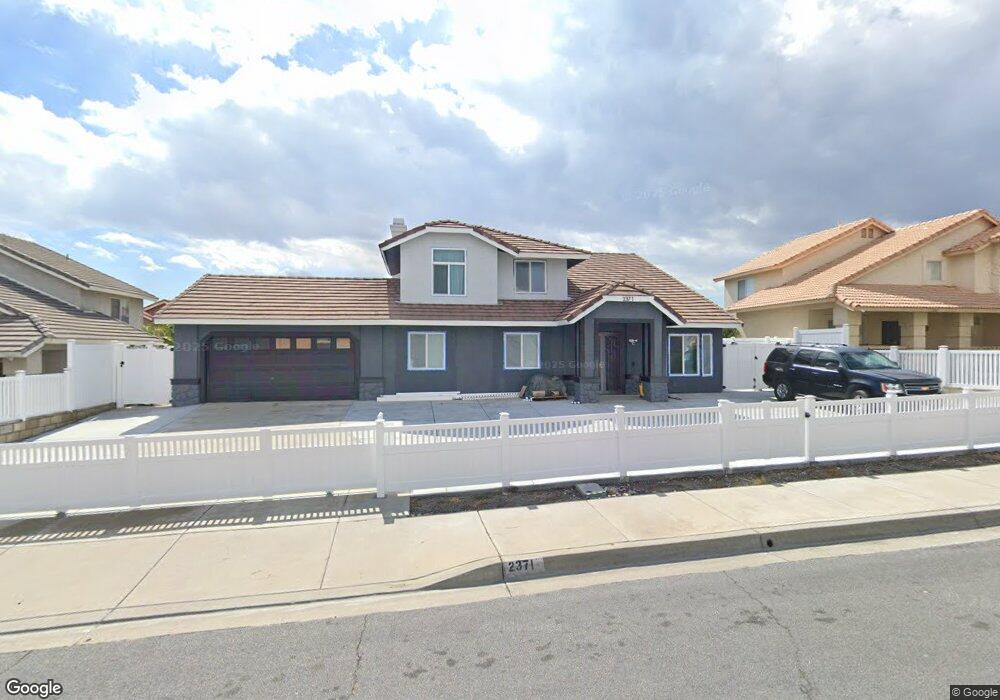
2371 W Via Bello Dr Rialto, CA 92377
Estimated Value: $732,071 - $785,000
4
Beds
3
Baths
2,496
Sq Ft
$306/Sq Ft
Est. Value
About This Home
This home is located at 2371 W Via Bello Dr, Rialto, CA 92377 and is currently estimated at $763,518, approximately $305 per square foot. 2371 W Via Bello Dr is a home located in San Bernardino County with nearby schools including Edward Fitzgerald Elementary School, Ethel Kucera Middle School, and Wilmer Amina Carter High School.
Ownership History
Date
Name
Owned For
Owner Type
Purchase Details
Closed on
May 3, 2021
Sold by
Ervin Genell and Ervin Genell R
Bought by
Ervin Genell R
Current Estimated Value
Home Financials for this Owner
Home Financials are based on the most recent Mortgage that was taken out on this home.
Original Mortgage
$363,000
Outstanding Balance
$328,969
Interest Rate
3.1%
Mortgage Type
New Conventional
Estimated Equity
$434,549
Purchase Details
Closed on
Jan 29, 2008
Sold by
Washington Mutual Bank Fa
Bought by
Ervin Genell
Home Financials for this Owner
Home Financials are based on the most recent Mortgage that was taken out on this home.
Original Mortgage
$324,901
Interest Rate
6.04%
Mortgage Type
FHA
Purchase Details
Closed on
Nov 10, 2007
Sold by
Kathabarwa Tina
Bought by
Washington Mutual Bank Fa
Purchase Details
Closed on
Jan 17, 2007
Sold by
Nyende Harrison
Bought by
Kathabarwa Tina
Home Financials for this Owner
Home Financials are based on the most recent Mortgage that was taken out on this home.
Original Mortgage
$448,000
Interest Rate
8.12%
Mortgage Type
Balloon
Purchase Details
Closed on
May 27, 2004
Sold by
Zabala Edward R and Zabala Michelle L
Bought by
Nyende Harrison
Home Financials for this Owner
Home Financials are based on the most recent Mortgage that was taken out on this home.
Original Mortgage
$318,240
Interest Rate
7%
Mortgage Type
Purchase Money Mortgage
Purchase Details
Closed on
Aug 8, 2002
Sold by
Zabala Michelle L
Bought by
Zabala Edward R and Zabala Michelle L
Home Financials for this Owner
Home Financials are based on the most recent Mortgage that was taken out on this home.
Original Mortgage
$150,000
Interest Rate
6.29%
Purchase Details
Closed on
Jul 30, 1998
Sold by
Zabala Edward
Bought by
Zabala Michelle L
Home Financials for this Owner
Home Financials are based on the most recent Mortgage that was taken out on this home.
Original Mortgage
$91,400
Interest Rate
6.92%
Purchase Details
Closed on
Feb 3, 1998
Sold by
Logue Connie and Young Billy M
Bought by
Group One Homes Jv
Home Financials for this Owner
Home Financials are based on the most recent Mortgage that was taken out on this home.
Original Mortgage
$22,050
Interest Rate
7.05%
Mortgage Type
Seller Take Back
Purchase Details
Closed on
Aug 1, 1996
Sold by
Nevada Tic Ii
Bought by
Logue Connie and Young Billy M
Create a Home Valuation Report for This Property
The Home Valuation Report is an in-depth analysis detailing your home's value as well as a comparison with similar homes in the area
Home Values in the Area
Average Home Value in this Area
Purchase History
| Date | Buyer | Sale Price | Title Company |
|---|---|---|---|
| Ervin Genell R | -- | Ticor Title Riverside | |
| Ervin Genell | $330,000 | Chicago Title Company | |
| Washington Mutual Bank Fa | $484,043 | None Available | |
| Kathabarwa Tina | $560,000 | Commonwealthlandtitle | |
| Nyende Harrison | $398,000 | Chicago Title Company | |
| Zabala Edward R | -- | American Title Co | |
| Zabala Michelle L | -- | First American Title Ins Co | |
| Zabala Michelle L | $175,000 | First American Title Ins Co | |
| Group One Homes Jv | $24,500 | First American Title Ins Co | |
| Logue Connie | $27,000 | Stewart Title |
Source: Public Records
Mortgage History
| Date | Status | Borrower | Loan Amount |
|---|---|---|---|
| Open | Ervin Genell R | $363,000 | |
| Closed | Ervin Genell | $324,901 | |
| Previous Owner | Kathabarwa Tina | $448,000 | |
| Previous Owner | Nyende Harrison | $318,240 | |
| Previous Owner | Zabala Edward R | $150,000 | |
| Previous Owner | Zabala Michelle L | $91,400 | |
| Previous Owner | Group One Homes Jv | $22,050 | |
| Closed | Nyende Harrison | $79,560 |
Source: Public Records
Tax History Compared to Growth
Tax History
| Year | Tax Paid | Tax Assessment Tax Assessment Total Assessment is a certain percentage of the fair market value that is determined by local assessors to be the total taxable value of land and additions on the property. | Land | Improvement |
|---|---|---|---|---|
| 2025 | $5,160 | $433,464 | $78,811 | $354,653 |
| 2024 | $5,160 | $424,965 | $77,266 | $347,699 |
| 2023 | $5,501 | $416,632 | $75,751 | $340,881 |
| 2022 | $5,107 | $408,463 | $74,266 | $334,197 |
| 2021 | $5,073 | $400,454 | $72,810 | $327,644 |
| 2020 | $5,105 | $396,347 | $72,063 | $324,284 |
| 2019 | $4,987 | $388,575 | $70,650 | $317,925 |
| 2018 | $4,840 | $380,956 | $69,265 | $311,691 |
| 2017 | $4,821 | $373,486 | $67,907 | $305,579 |
| 2016 | $4,896 | $366,162 | $66,575 | $299,587 |
| 2015 | $5,060 | $360,662 | $65,575 | $295,087 |
| 2014 | $4,565 | $334,000 | $117,000 | $217,000 |
Source: Public Records
Map
Nearby Homes
- 2540 W Via Bello Dr
- 3333 N Daisy Dr
- 2768 W Buena Vista Dr
- 2120 W Windhaven Dr
- 2516 Yellowstone Way
- 2147 W Fairview Dr
- 4788 Condor Ave
- 17026 Schneider St
- 17012 Hal Ln
- 1844 W Coast Blvd
- 16708 Yarrow Ln
- 16707 Island Oak St
- 16736 Grapefruit Ln
- 1770 W Candlewood Ave
- 18019 Lapis Ln
- 5345 Blue Ridge Way
- 3863 American Elm Rd
- 17921 Valerian Way
- 16612 Botanical Ln
- Plan 3 at The Arboretum - Trellis
- 2383 W Via Bello Dr
- 2359 W Via Bello Dr
- 2418 W Calle Celeste Dr
- 2408 W Calle Celeste Dr
- 2428 W Calle Celeste Dr
- 2347 W Via Bello Dr
- 2395 W Via Bello Dr
- 3701 N Tamarind Ave
- 2396 W Calle Celeste Dr
- 2438 W Calle Celeste Dr
- 3702 N Tamarind Ave
- 3624 N Plum Tree Ave
- 2405 W Via Bello Dr
- 2335 W Via Bello Dr
- 3683 N Tamarind Ave
- 3711 N Tamarind Ave
- 2386 W Calle Celeste Dr
- 2421 W Calle Celeste Dr
- 2448 W Calle Celeste Dr
- 3712 N Tamarind Ave