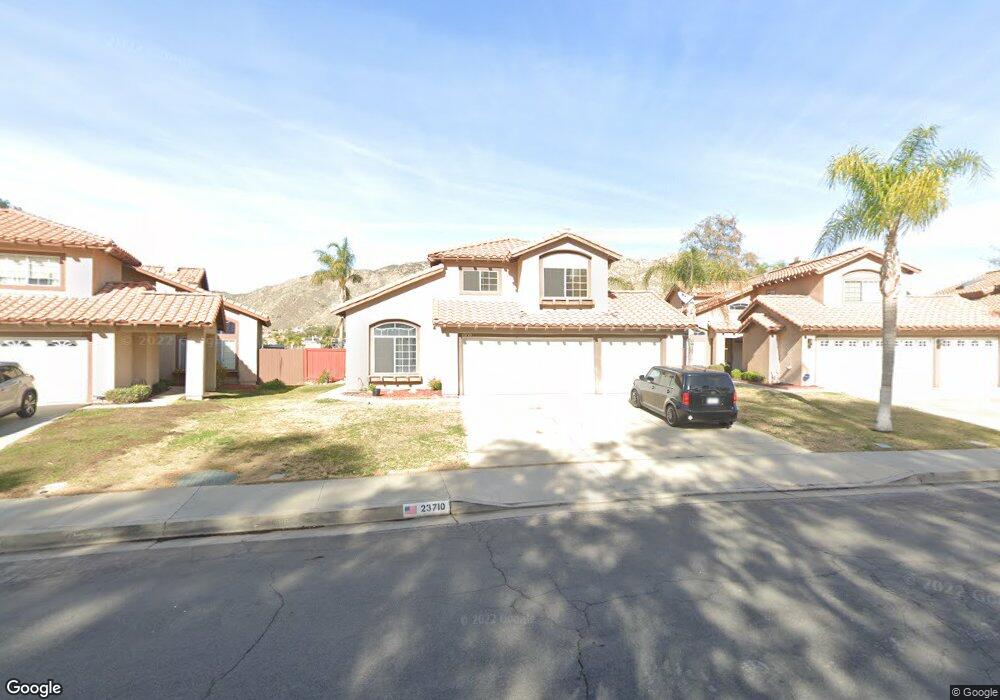
23710 Cedar Creek Terrace Moreno Valley, CA 92557
Hidden Springs NeighborhoodEstimated Value: $543,000 - $578,000
3
Beds
2
Baths
1,699
Sq Ft
$333/Sq Ft
Est. Value
About This Home
This home is located at 23710 Cedar Creek Terrace, Moreno Valley, CA 92557 and is currently estimated at $565,124, approximately $332 per square foot. 23710 Cedar Creek Terrace is a home located in Riverside County with nearby schools including Sugar Hill Elementary School, Vista Heights Middle School, and Canyon Springs High School.
Ownership History
Date
Name
Owned For
Owner Type
Purchase Details
Closed on
Sep 7, 2006
Sold by
Netwig Chad and Netwig Lena
Bought by
Graziadio Denise Michelle
Current Estimated Value
Home Financials for this Owner
Home Financials are based on the most recent Mortgage that was taken out on this home.
Original Mortgage
$335,200
Outstanding Balance
$197,990
Interest Rate
6.37%
Mortgage Type
Purchase Money Mortgage
Estimated Equity
$367,134
Purchase Details
Closed on
Mar 15, 1997
Sold by
Federal National Mortgage Association
Bought by
Netwig Chad and Netwig Lena
Home Financials for this Owner
Home Financials are based on the most recent Mortgage that was taken out on this home.
Original Mortgage
$120,087
Interest Rate
7.63%
Mortgage Type
FHA
Purchase Details
Closed on
Dec 26, 1996
Sold by
Kruckeberg James K and Kruckeberg Carol J
Bought by
Federal National Mortgage Association
Create a Home Valuation Report for This Property
The Home Valuation Report is an in-depth analysis detailing your home's value as well as a comparison with similar homes in the area
Home Values in the Area
Average Home Value in this Area
Purchase History
| Date | Buyer | Sale Price | Title Company |
|---|---|---|---|
| Graziadio Denise Michelle | $419,000 | Lawyers Title Co | |
| Netwig Chad | $129,000 | Commonwealth Land Title Co | |
| Federal National Mortgage Association | $117,500 | Chicago Title |
Source: Public Records
Mortgage History
| Date | Status | Borrower | Loan Amount |
|---|---|---|---|
| Open | Graziadio Denise Michelle | $335,200 | |
| Previous Owner | Netwig Chad | $120,087 |
Source: Public Records
Tax History Compared to Growth
Tax History
| Year | Tax Paid | Tax Assessment Tax Assessment Total Assessment is a certain percentage of the fair market value that is determined by local assessors to be the total taxable value of land and additions on the property. | Land | Improvement |
|---|---|---|---|---|
| 2025 | $5,829 | $561,345 | $160,760 | $400,585 |
| 2023 | $5,829 | $478,082 | $137,040 | $341,042 |
| 2022 | $4,937 | $434,619 | $124,581 | $310,038 |
| 2021 | $4,197 | $368,321 | $105,577 | $262,744 |
| 2020 | $3,753 | $328,859 | $94,266 | $234,593 |
| 2019 | $3,655 | $319,280 | $91,520 | $227,760 |
| 2018 | $3,514 | $307,000 | $88,000 | $219,000 |
| 2017 | $3,746 | $294,000 | $84,000 | $210,000 |
| 2016 | $3,328 | $286,000 | $82,000 | $204,000 |
| 2015 | $3,436 | $268,000 | $77,000 | $191,000 |
| 2014 | $2,755 | $251,000 | $72,000 | $179,000 |
Source: Public Records
Map
Nearby Homes
- 23752 Timber Bluff Ct
- 23614 Tonada Ln
- 23760 Timber Bluff Ct
- 23638 Airosa Place
- 10991 Mendoza Rd
- 23878 Bouquet Canyon Place
- 23759 Heliotrope Way
- 10199 Caribou Cir
- 10685 Ridgefield Terrace
- 10201 Coral Ln
- 10731 Park Rim Cir
- 23639 Lake Valley Dr
- 10560 Canyon Vista Rd
- 23426 Mariner Way
- 10641 Breezy Meadow Dr
- 10189 Via Apolina
- 0 Cantarini Rd Unit 219045579
- 0 Box Springs Rd Unit CV25064688
- 10917 Breezy Meadow Dr
- 23587 Parkland Ave
- 23702 Cedar Creek Terrace
- 23718 Cedar Creek Terrace
- 23726 Cedar Creek Terrace
- 23678 Cedar Creek Terrace
- 23734 Cedar Creek Terrace
- 23670 Cedar Creek Terrace
- 23742 Cedar Creek Terrace
- 23706 Waterleaf Cir
- 23714 Waterleaf Cir
- 23750 Cedar Creek Terrace
- 23662 Cedar Creek Terrace
- 23722 Waterleaf Cir
- 23758 Cedar Creek Terrace
- 23654 Cedar Creek Terrace
- 10474 Peppergrass Way
- 23646 Cedar Creek Terrace
- 23738 Waterleaf Cir
- 23774 Cedar Creek Terrace
- 10480 Peppergrass Way
- 23729 Waterleaf Cir