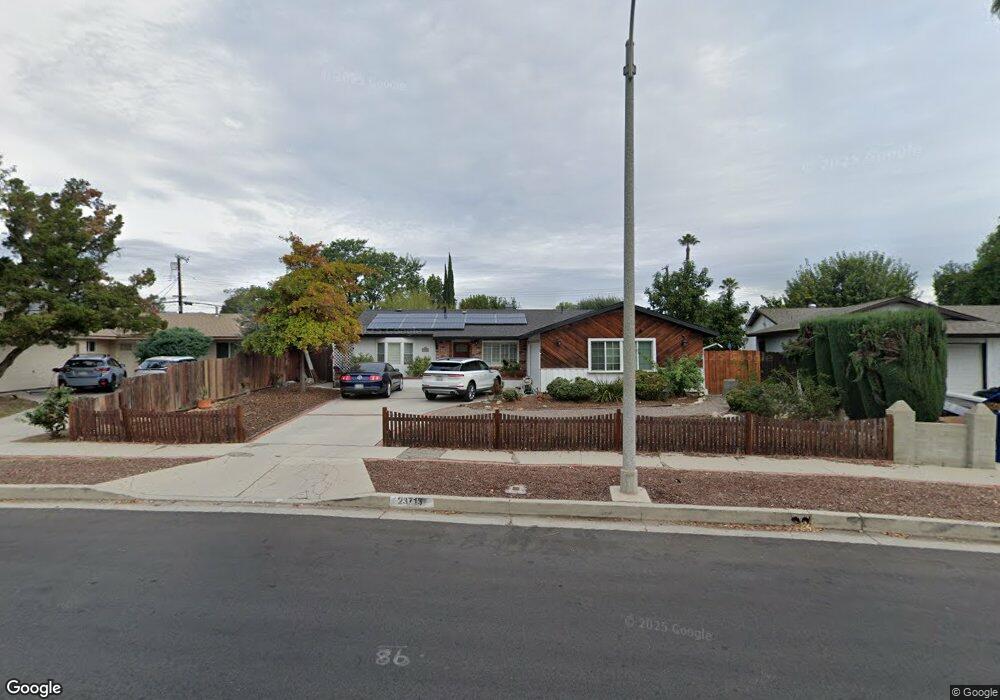
23713 Sylvan St Woodland Hills, CA 91367
Estimated Value: $1,015,000 - $1,058,000
4
Beds
2
Baths
1,512
Sq Ft
$685/Sq Ft
Est. Value
About This Home
This home is located at 23713 Sylvan St, Woodland Hills, CA 91367 and is currently estimated at $1,036,025, approximately $685 per square foot. 23713 Sylvan St is a home located in Los Angeles County with nearby schools including Lockhurst Drive Charter Elementary, Haynes Charter For Enriched Studies, and Woodlake Elementary Community Charter.
Ownership History
Date
Name
Owned For
Owner Type
Purchase Details
Closed on
Jun 26, 2025
Sold by
Mistretta William Otis and Mistretta Mary Lee
Bought by
William Otis Mistretta & Mary Lee Mistretta J and Mistretta
Current Estimated Value
Purchase Details
Closed on
May 19, 1999
Sold by
Rodriguez Adelaida A
Bought by
Mistretta William O and Mistretta Mary Lee
Home Financials for this Owner
Home Financials are based on the most recent Mortgage that was taken out on this home.
Original Mortgage
$149,800
Interest Rate
6.84%
Purchase Details
Closed on
Apr 28, 1998
Sold by
Stein Ann M
Bought by
Rodriguez Adelaida A
Home Financials for this Owner
Home Financials are based on the most recent Mortgage that was taken out on this home.
Original Mortgage
$218,450
Interest Rate
6.5%
Create a Home Valuation Report for This Property
The Home Valuation Report is an in-depth analysis detailing your home's value as well as a comparison with similar homes in the area
Home Values in the Area
Average Home Value in this Area
Purchase History
| Date | Buyer | Sale Price | Title Company |
|---|---|---|---|
| William Otis Mistretta & Mary Lee Mistretta J | -- | None Listed On Document | |
| Mistretta William Otis | -- | None Listed On Document | |
| Mistretta William O | $275,000 | Fidelity Title | |
| Rodriguez Adelaida A | $243,000 | First American Title | |
| Rodriguez Adelaida A | -- | First American Title Co |
Source: Public Records
Mortgage History
| Date | Status | Borrower | Loan Amount |
|---|---|---|---|
| Previous Owner | Mistretta William O | $149,800 | |
| Previous Owner | Rodriguez Adelaida A | $218,450 |
Source: Public Records
Tax History Compared to Growth
Tax History
| Year | Tax Paid | Tax Assessment Tax Assessment Total Assessment is a certain percentage of the fair market value that is determined by local assessors to be the total taxable value of land and additions on the property. | Land | Improvement |
|---|---|---|---|---|
| 2025 | $5,490 | $431,097 | $254,269 | $176,828 |
| 2024 | $5,490 | $422,645 | $249,284 | $173,361 |
| 2023 | $5,389 | $414,359 | $244,397 | $169,962 |
| 2022 | $5,148 | $406,235 | $239,605 | $166,630 |
| 2021 | $5,083 | $398,270 | $234,907 | $163,363 |
| 2019 | $4,937 | $386,459 | $227,941 | $158,518 |
| 2018 | $4,807 | $378,882 | $223,472 | $155,410 |
| 2016 | $4,590 | $364,172 | $214,796 | $149,376 |
| 2015 | $4,525 | $358,703 | $211,570 | $147,133 |
| 2014 | $4,548 | $351,677 | $207,426 | $144,251 |
Source: Public Records
Map
Nearby Homes
- 6236 Kenwater Ave
- 6416 Kenwater Place
- 23812 Calvert St
- 23549 Victory Blvd Unit 21
- 6172 Dalecrest Ave
- 6227 Glide Ave
- 6153 Debs Ave
- 23432 Victory Blvd
- 24017 Sylvan St
- 6001 Manton Ave
- 5929 Adler Ave
- 6022 Elba Place
- 6670 Platt Ave
- 24208 Gilmore St
- 23928 Archwood St
- 24244 Friar St
- 6544 Sheltondale Ave
- 6009 Neddy Ave
- 5931 Neddy Ave
- 23238 Victory Blvd
- 23719 Sylvan St
- 23707 Sylvan St
- 23725 Sylvan St
- 6249 Platt Ave
- 23731 Sylvan St
- 6242 Kenwater Ave
- 23800 Friar St
- 6300 Kenwater Ave
- 6243 Platt Ave
- 23806 Friar St
- 23737 Sylvan St
- 23812 Friar St
- 6245 Platt Ave
- 6235 Platt Ave
- 23801 Sylvan St
- 6308 Kenwater Ave
- 6230 Kenwater Ave
- 23818 Friar St
- 6272 Platt Ave
- 6241 Kenwater Ave