23713 W Ash St Plainfield, IL 60544
East Plainfield NeighborhoodEstimated Value: $380,000 - $435,000
3
Beds
2
Baths
1,800
Sq Ft
$225/Sq Ft
Est. Value
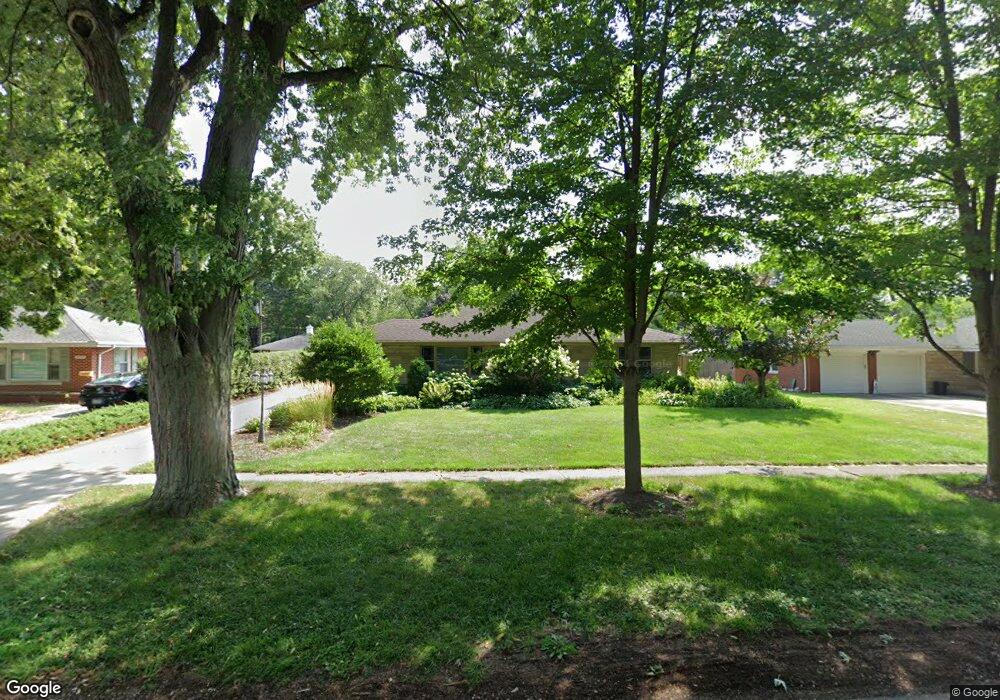
About This Home
This home is located at 23713 W Ash St, Plainfield, IL 60544 and is currently estimated at $405,527, approximately $225 per square foot. 23713 W Ash St is a home located in Will County with nearby schools including Central Elementary School, Indian Trail Middle School, and Plainfield Central High School.
Ownership History
Date
Name
Owned For
Owner Type
Purchase Details
Closed on
Sep 13, 2017
Sold by
Nickel Kevin J and Nickel Stephani
Bought by
Kuhl Dennis and Kuhl Theresa
Current Estimated Value
Home Financials for this Owner
Home Financials are based on the most recent Mortgage that was taken out on this home.
Original Mortgage
$225,600
Outstanding Balance
$185,646
Interest Rate
3.37%
Mortgage Type
Adjustable Rate Mortgage/ARM
Estimated Equity
$219,881
Purchase Details
Closed on
Apr 1, 2009
Sold by
Nickel Kevin J
Bought by
Nickel Kevin J and Nickel Stephanie L
Purchase Details
Closed on
Jun 27, 2008
Sold by
Houlis Peter B and Houlis Mary P
Bought by
Nickel Kevin J
Home Financials for this Owner
Home Financials are based on the most recent Mortgage that was taken out on this home.
Original Mortgage
$218,570
Interest Rate
6.1%
Mortgage Type
FHA
Create a Home Valuation Report for This Property
The Home Valuation Report is an in-depth analysis detailing your home's value as well as a comparison with similar homes in the area
Home Values in the Area
Average Home Value in this Area
Purchase History
| Date | Buyer | Sale Price | Title Company |
|---|---|---|---|
| Kuhl Dennis | $282,000 | Fidelity Title | |
| Nickel Kevin J | -- | None Available | |
| Nickel Kevin J | $222,000 | First American Title |
Source: Public Records
Mortgage History
| Date | Status | Borrower | Loan Amount |
|---|---|---|---|
| Open | Kuhl Dennis | $225,600 | |
| Previous Owner | Nickel Kevin J | $218,570 |
Source: Public Records
Tax History
| Year | Tax Paid | Tax Assessment Tax Assessment Total Assessment is a certain percentage of the fair market value that is determined by local assessors to be the total taxable value of land and additions on the property. | Land | Improvement |
|---|---|---|---|---|
| 2024 | $7,260 | $112,777 | $22,117 | $90,660 |
| 2023 | $7,260 | $101,858 | $19,976 | $81,882 |
| 2022 | $6,540 | $91,482 | $17,941 | $73,541 |
| 2021 | $6,174 | $85,497 | $16,767 | $68,730 |
| 2020 | $6,179 | $83,071 | $16,291 | $66,780 |
| 2019 | $5,872 | $79,153 | $15,523 | $63,630 |
| 2018 | $4,960 | $66,470 | $14,584 | $51,886 |
| 2017 | $4,802 | $63,166 | $13,859 | $49,307 |
| 2016 | $4,681 | $60,244 | $13,218 | $47,026 |
| 2015 | $4,812 | $56,434 | $12,382 | $44,052 |
| 2014 | $4,812 | $59,448 | $16,951 | $42,497 |
| 2013 | $4,812 | $59,448 | $16,951 | $42,497 |
Source: Public Records
Map
Nearby Homes
- 23625 W Main St
- 14632 S Kearns Dr
- 23909 W Main St
- 23201 W Kennebec Dr
- 14600 Paul Revere Ln
- 000 Wood Farm Rd
- 15111 S Fox River St
- 13752 Capista Dr Unit 2
- 25518 W Stockwell Dr
- 25500 W Alabaster Cir
- 14955 S Mccarthy Cir
- 14953 S Mccarthy Cir
- 15001 S Darr Dr
- 14937 S Mccarthy Cir
- 25531 W Alabaster Cir
- 14959 S Mccarthy Cir
- 14849 S Henebry Ln
- 25435 W Alabaster Cir
- 25508 W Alabaster Cir
- 14853 S Henebry Ln
- 23709 W Ash St
- 14423 S Naperville Rd
- 23717 W Ash St
- 14427 S Naperville Rd
- 23705 W Ash St Unit 1
- 23710 W Ash St
- 23710 W Ash St
- 23718 W Ash St
- 23701 W Ash St Unit 1
- 14431 S Naperville Rd
- 14411 S Naperville Rd
- 23700 W Ash St
- 23621 W Ash St
- 14414 S Garden Ct
- 14415 S Garden Ct
- 14407 S Naperville Rd
- 14501 S Naperville Rd
- 14506 S Maple Ct
- 14508 S Maple Ct
- 23615 W Ash St
Your Personal Tour Guide
Ask me questions while you tour the home.