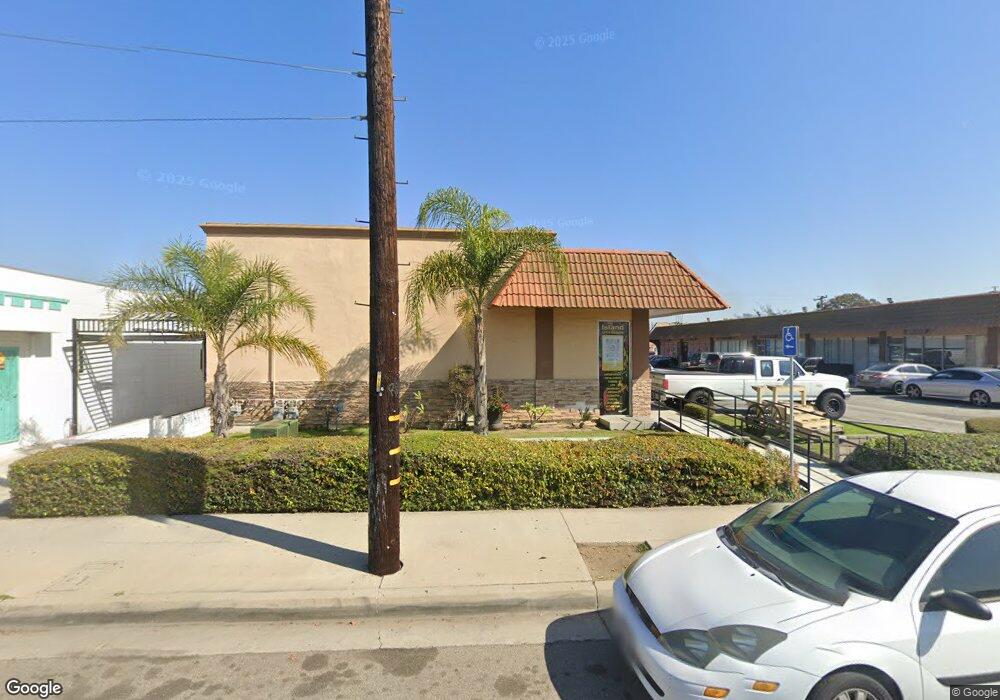
23726 Main St Carson, CA 90745
Estimated Value: $2,918,624
Studio
14
Baths
11,160
Sq Ft
$262/Sq Ft
Est. Value
About This Home
This home is located at 23726 Main St, Carson, CA 90745 and is currently estimated at $2,918,624, approximately $261 per square foot. 23726 Main St is a home located in Los Angeles County with nearby schools including Catskill Avenue Elementary School, Wilmington Middle School STEAM Magnet, and Stephen M. White Middle School.
Ownership History
Date
Name
Owned For
Owner Type
Purchase Details
Closed on
Dec 8, 2015
Sold by
Tcharbakhshi Siransuh
Bought by
Ystchabakhshi Family Living Trust and Trust B
Current Estimated Value
Purchase Details
Closed on
Dec 7, 2012
Sold by
Dimalanta Cristeta and Quinol Ricardo A
Bought by
Tcharbakhshi Yuesh and Tcharbakhshi Siranush
Purchase Details
Closed on
Dec 6, 2006
Sold by
Palting Melchor N and Palting Gregoria A
Bought by
Palting Melchor N
Purchase Details
Closed on
Apr 30, 2004
Sold by
Quinol Ricardo A and Quinol Llura A
Bought by
Quinol Ricardo A
Purchase Details
Closed on
Mar 29, 2004
Sold by
Dimalanta Cristeta
Bought by
Dimalanta Cristeta
Purchase Details
Closed on
Jun 29, 1993
Sold by
Trust Nang Agustin C Co Tr Nang Fa and Dimalanta Cristeta
Bought by
Palting Melchor N
Create a Home Valuation Report for This Property
The Home Valuation Report is an in-depth analysis detailing your home's value as well as a comparison with similar homes in the area
Home Values in the Area
Average Home Value in this Area
Purchase History
| Date | Buyer | Sale Price | Title Company |
|---|---|---|---|
| Ystchabakhshi Family Living Trust | -- | None Available | |
| Tcharbakhshi Yuesh | $1,240,000 | Pacific Coast Title | |
| Palting Melchor N | -- | None Available | |
| Quinol Ricardo A | -- | -- | |
| Quinol Ricardo A | -- | -- | |
| Dimalanta Cristeta | -- | -- | |
| Palting Melchor N | -- | -- |
Source: Public Records
Tax History
| Year | Tax Paid | Tax Assessment Tax Assessment Total Assessment is a certain percentage of the fair market value that is determined by local assessors to be the total taxable value of land and additions on the property. | Land | Improvement |
|---|---|---|---|---|
| 2025 | $25,031 | $1,526,958 | $918,024 | $608,934 |
| 2024 | $25,031 | $1,497,019 | $900,024 | $596,995 |
| 2023 | $24,585 | $1,467,667 | $882,377 | $585,290 |
| 2022 | $23,554 | $1,438,890 | $865,076 | $573,814 |
| 2021 | $23,226 | $1,410,677 | $848,114 | $562,563 |
| 2019 | $19,230 | $1,368,837 | $822,959 | $545,878 |
| 2018 | $18,433 | $1,341,998 | $806,823 | $535,175 |
| 2016 | $17,535 | $1,289,889 | $775,494 | $514,395 |
| 2015 | $17,937 | $1,270,515 | $763,846 | $506,669 |
| 2014 | $17,890 | $1,245,629 | $748,884 | $496,745 |
Source: Public Records
Map
Nearby Homes
- 208 W 234th Place
- 23616 Panama Ave
- 22719 Gulf Ave
- 11 Eastridge Ln
- 24809 Carmel Dr
- 41 Scottsdale S
- 23220 Colony Park Dr
- 22729 Marbella Ave
- 424 W 230th St
- 624 E Pacific St
- 445 E 248th St
- 806 Coriander Dr Unit C
- 826 Coriander Dr Unit D
- 812 Coriander Dr Unit F
- 23314 Sesame St Unit D
- 2 Jackrabbit Ln
- 23304 Sesame St Unit 16R
- 23334 Sesame St Unit E
- 802 Coriander Dr Unit B
- 23200 Sesame St Unit D
Your Personal Tour Guide
Ask me questions while you tour the home.