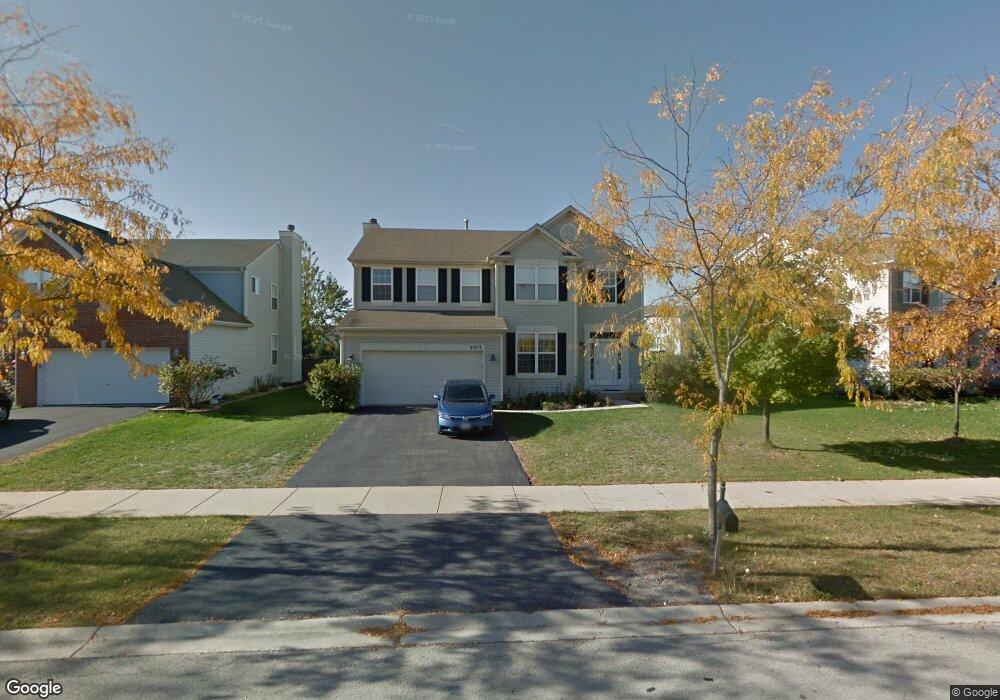
2373 Shiloh Dr Unit 1 Aurora, IL 60503
Far Southeast NeighborhoodEstimated Value: $422,000 - $457,000
4
Beds
3
Baths
1,600
Sq Ft
$271/Sq Ft
Est. Value
About This Home
This home is located at 2373 Shiloh Dr Unit 1, Aurora, IL 60503 and is currently estimated at $434,197, approximately $271 per square foot. 2373 Shiloh Dr Unit 1 is a home located in Will County with nearby schools including Wolfs Crossing Elementary School, Bednarcik Jr. High School, and Oswego East High School.
Ownership History
Date
Name
Owned For
Owner Type
Purchase Details
Closed on
Jan 24, 2011
Sold by
Bank Of New York Mellon
Bought by
Cazares Miguel A and Partida Carmen L
Current Estimated Value
Home Financials for this Owner
Home Financials are based on the most recent Mortgage that was taken out on this home.
Original Mortgage
$168,872
Interest Rate
4.75%
Mortgage Type
FHA
Purchase Details
Closed on
Oct 12, 2010
Sold by
Morris Leekeasha M and Morris Hanif
Bought by
Bank Of New York Mellon and The Bank Of New York
Purchase Details
Closed on
Jul 30, 2001
Sold by
The Ryland Group Inc
Bought by
Morris Leekeasha M and Morris Hanif
Home Financials for this Owner
Home Financials are based on the most recent Mortgage that was taken out on this home.
Original Mortgage
$220,724
Interest Rate
7.11%
Mortgage Type
FHA
Create a Home Valuation Report for This Property
The Home Valuation Report is an in-depth analysis detailing your home's value as well as a comparison with similar homes in the area
Home Values in the Area
Average Home Value in this Area
Purchase History
| Date | Buyer | Sale Price | Title Company |
|---|---|---|---|
| Cazares Miguel A | $176,000 | Fidelity National Title | |
| Bank Of New York Mellon | -- | None Available | |
| Morris Leekeasha M | $224,000 | Ticor Title |
Source: Public Records
Mortgage History
| Date | Status | Borrower | Loan Amount |
|---|---|---|---|
| Previous Owner | Cazares Miguel A | $168,872 | |
| Previous Owner | Morris Leekeasha M | $220,724 |
Source: Public Records
Tax History
| Year | Tax Paid | Tax Assessment Tax Assessment Total Assessment is a certain percentage of the fair market value that is determined by local assessors to be the total taxable value of land and additions on the property. | Land | Improvement |
|---|---|---|---|---|
| 2024 | $10,683 | $130,566 | $23,259 | $107,307 |
| 2023 | $10,683 | $115,341 | $20,547 | $94,794 |
| 2022 | $9,460 | $101,056 | $19,437 | $81,619 |
| 2021 | $9,400 | $96,243 | $18,511 | $77,732 |
| 2020 | $8,999 | $94,718 | $18,218 | $76,500 |
| 2019 | $9,093 | $92,049 | $17,705 | $74,344 |
| 2018 | $9,026 | $88,498 | $17,315 | $71,183 |
| 2017 | $8,876 | $86,213 | $16,868 | $69,345 |
| 2016 | $8,441 | $84,357 | $16,505 | $67,852 |
| 2015 | $8,930 | $81,112 | $15,870 | $65,242 |
| 2014 | $8,930 | $80,570 | $15,870 | $64,700 |
| 2013 | $8,930 | $80,570 | $15,870 | $64,700 |
Source: Public Records
Map
Nearby Homes
- 2263 Shiloh Dr Unit 2
- 10140 S Eola Rd
- 2156 Sunrise Cir
- 2125 Sunrise Cir Unit 27
- 2197 Wilson Creek Cir Unit 3
- 2327 Georgetown Cir Unit 18/4
- 2503 Bayhill Ct
- 2495 Hafenrichter Rd
- 3328 Fulshear Cir
- 3237 Peyton Cir
- 3235 Kimblewick Cir
- 3302 Wildlight Rd
- 2812 Stuart Kaplan Ct
- 1893 Indian Hill Ln Unit 4053
- 2255 Georgetown Cir
- 2413 Dickens Dr
- 2598 Hillsboro Blvd
- 2723 Hillsboro Blvd
- 2735 Hillsboro Blvd Unit 3
- 1851 Indian Hill Ln Unit 4083
- 2369 Shiloh Dr
- 2375 Shiloh Dr
- 2517 Red Hawk Ridge Dr Unit 1
- 2361 Shiloh Dr
- 2525 Red Hawk Ridge Dr
- 2355 Shiloh Dr
- 2349 Shiloh Dr Unit 1
- 2347 Shiloh Dr Unit 1
- 2381 Shiloh Dr
- 2499 Red Hawk Ridge Ct Unit 1
- 2345 Shiloh Dr
- 2368 Shiloh Dr
- 2366 Shiloh Dr
- 2533 Red Hawk Ridge Dr Unit 1
- 2364 Shiloh Dr
- 2364 Shiloh Dr Unit SI ID1323713P
- 2370 Shiloh Dr Unit 1
- 2343 Shiloh Dr Unit 1
- 2497 Red Hawk Ridge Ct
- 2362 Shiloh Dr Unit 1
Your Personal Tour Guide
Ask me questions while you tour the home.