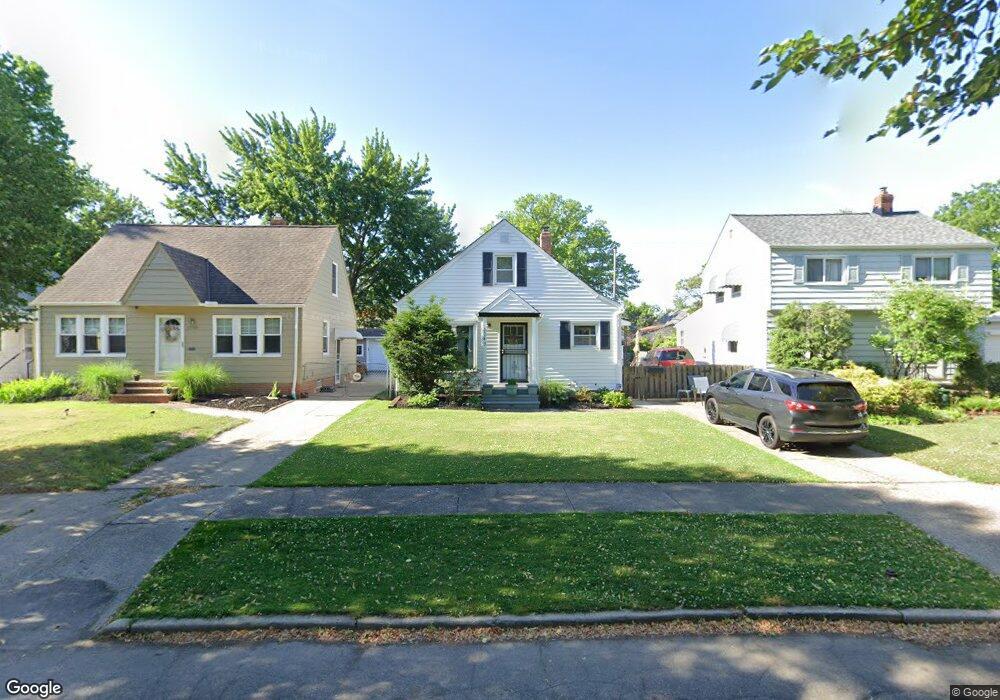
23740 Alberton Rd Euclid, OH 44123
Estimated Value: $121,405 - $137,000
3
Beds
1
Bath
1,122
Sq Ft
$116/Sq Ft
Est. Value
About This Home
This home is located at 23740 Alberton Rd, Euclid, OH 44123 and is currently estimated at $129,601, approximately $115 per square foot. 23740 Alberton Rd is a home located in Cuyahoga County with nearby schools including Bluestone Elementary School, Euclid High School, and Pinnacle Academy.
Ownership History
Date
Name
Owned For
Owner Type
Purchase Details
Closed on
Jun 1, 2012
Sold by
Carter Sheila and Haynes Sheila
Bought by
Carter Sheila
Current Estimated Value
Home Financials for this Owner
Home Financials are based on the most recent Mortgage that was taken out on this home.
Original Mortgage
$69,840
Outstanding Balance
$9,921
Interest Rate
3.11%
Mortgage Type
New Conventional
Estimated Equity
$119,680
Purchase Details
Closed on
Jan 18, 1994
Sold by
Engelking Cynthia L
Bought by
Haynes Shelia
Purchase Details
Closed on
Apr 29, 1993
Sold by
Morek Steven M
Bought by
Engelking Cynthia L
Purchase Details
Closed on
Nov 24, 1987
Sold by
Albanese Jacob M and Albanese Nancy
Bought by
Morek Steven M
Purchase Details
Closed on
Aug 16, 1984
Sold by
Bratelj Helen E
Bought by
Albanese Jacob M and Albanese Nancy
Purchase Details
Closed on
Jan 1, 1975
Bought by
Bratelj Helen E
Create a Home Valuation Report for This Property
The Home Valuation Report is an in-depth analysis detailing your home's value as well as a comparison with similar homes in the area
Home Values in the Area
Average Home Value in this Area
Purchase History
| Date | Buyer | Sale Price | Title Company |
|---|---|---|---|
| Carter Sheila | -- | None Available | |
| Haynes Shelia | $57,900 | -- | |
| Engelking Cynthia L | -- | -- | |
| Morek Steven M | $49,000 | -- | |
| Albanese Jacob M | $43,000 | -- | |
| Bratelj Helen E | -- | -- |
Source: Public Records
Mortgage History
| Date | Status | Borrower | Loan Amount |
|---|---|---|---|
| Open | Carter Sheila | $69,840 |
Source: Public Records
Tax History Compared to Growth
Tax History
| Year | Tax Paid | Tax Assessment Tax Assessment Total Assessment is a certain percentage of the fair market value that is determined by local assessors to be the total taxable value of land and additions on the property. | Land | Improvement |
|---|---|---|---|---|
| 2024 | $2,846 | $41,125 | $7,700 | $33,425 |
| 2023 | $2,505 | $28,740 | $5,810 | $22,930 |
| 2022 | $2,448 | $28,740 | $5,810 | $22,930 |
| 2021 | $2,725 | $28,740 | $5,810 | $22,930 |
| 2020 | $2,586 | $24,780 | $5,010 | $19,780 |
| 2019 | $2,324 | $70,800 | $14,300 | $56,500 |
| 2018 | $2,348 | $24,780 | $5,010 | $19,780 |
| 2017 | $2,546 | $22,510 | $4,170 | $18,340 |
| 2016 | $2,551 | $22,510 | $4,170 | $18,340 |
| 2015 | $2,323 | $22,510 | $4,170 | $18,340 |
| 2014 | $2,323 | $22,510 | $4,170 | $18,340 |
Source: Public Records
Map
Nearby Homes
- 23901 Colbourne Rd
- 23880 Hartland Dr
- 24330 Glenforest Rd
- 23896 Devoe Ave
- 860 E 245th St
- 24451 Devoe Ave
- 820 E 250th St
- 833 E 250th St
- 22751 Fox Ave
- 490 Kenwood Dr Unit B
- 23198 Gay St
- 450 Kenwood Dr Unit E12
- 461 Kenwood Dr Unit T3
- 422 Clearview Dr Unit J10
- 22301 Milton Dr
- 515 E 222nd St
- 23050 Tracy Ave
- 720 E 254th St
- 23337 Williams Ave
- 861 E 256th St
- 23780 Alberton Rd
- 23720 Alberton Rd
- 23800 Alberton Rd
- 23700 Alberton Rd
- 23741 Colbourne Rd
- 23781 Colbourne Rd
- 23820 Alberton Rd
- 23721 Colbourne Rd
- 23801 Colbourne Rd
- 23731 Alberton Rd
- 23840 Alberton Rd
- 23781 Alberton Rd
- 23660 Hartland Dr
- 23801 Alberton Rd
- 23661 Colbourne Rd
- 23841 Colbourne Rd
- 23680 Hartland Dr
- 23860 Alberton Rd
- 23821 Alberton Rd
- 23700 Hartland Dr