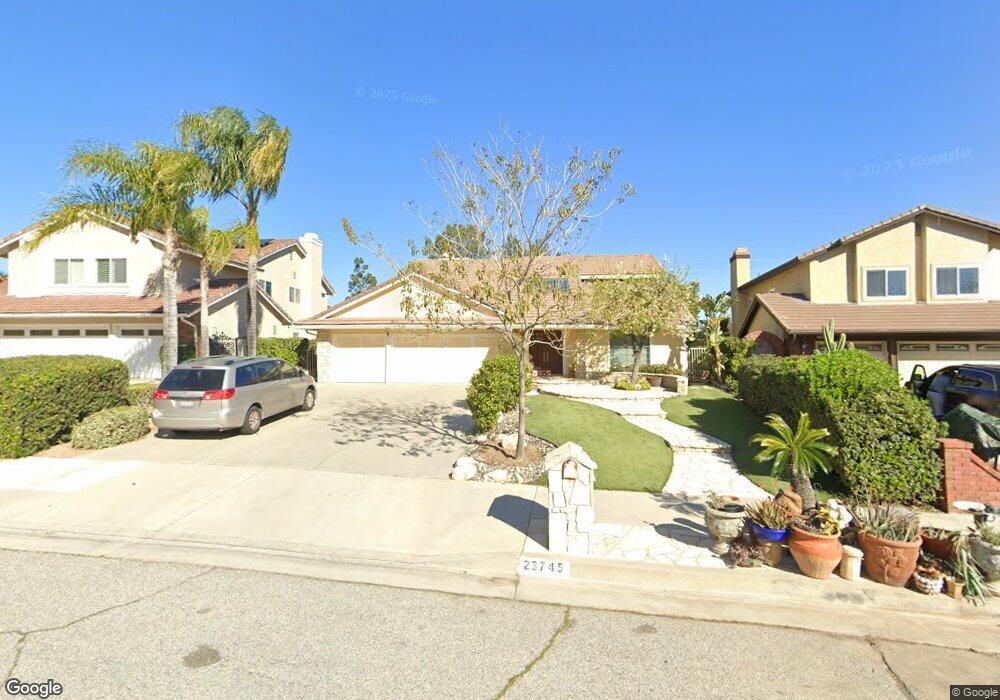
23745 Burton St Canoga Park, CA 91304
Canoga Park NeighborhoodEstimated Value: $1,148,000 - $1,333,000
3
Beds
3
Baths
2,315
Sq Ft
$537/Sq Ft
Est. Value
About This Home
This home is located at 23745 Burton St, Canoga Park, CA 91304 and is currently estimated at $1,242,601, approximately $536 per square foot. 23745 Burton St is a home located in Los Angeles County with nearby schools including Pomelo Community Charter, Justice Street Academy Charter, and Enadia Way Technology Charter.
Ownership History
Date
Name
Owned For
Owner Type
Purchase Details
Closed on
Jun 6, 2008
Sold by
Wells Fargo Bank Na
Bought by
Acuna Bernard and Garcia Rita
Current Estimated Value
Home Financials for this Owner
Home Financials are based on the most recent Mortgage that was taken out on this home.
Original Mortgage
$468,000
Outstanding Balance
$299,391
Interest Rate
5.99%
Mortgage Type
Purchase Money Mortgage
Estimated Equity
$943,210
Purchase Details
Closed on
Jan 11, 2008
Sold by
Voskanyan Elichka
Bought by
Wells Fargo Bank Na
Purchase Details
Closed on
Nov 14, 2006
Sold by
Floyd Harry and Floyd Deirdre
Bought by
Voskanyan Elichka
Home Financials for this Owner
Home Financials are based on the most recent Mortgage that was taken out on this home.
Original Mortgage
$663,900
Interest Rate
8.25%
Mortgage Type
Purchase Money Mortgage
Purchase Details
Closed on
Nov 14, 2001
Sold by
Floyd Harry J and Floyd Deirdre A
Bought by
Floyd Harry and Floyd Deirdre
Create a Home Valuation Report for This Property
The Home Valuation Report is an in-depth analysis detailing your home's value as well as a comparison with similar homes in the area
Home Values in the Area
Average Home Value in this Area
Purchase History
| Date | Buyer | Sale Price | Title Company |
|---|---|---|---|
| Acuna Bernard | $585,000 | Lsi Title Fnds Division | |
| Wells Fargo Bank Na | $711,000 | None Available | |
| Voskanyan Elichka | $830,000 | Fidelity National Title | |
| Floyd Harry | -- | -- |
Source: Public Records
Mortgage History
| Date | Status | Borrower | Loan Amount |
|---|---|---|---|
| Open | Acuna Bernard | $468,000 | |
| Previous Owner | Voskanyan Elichka | $663,900 |
Source: Public Records
Tax History Compared to Growth
Tax History
| Year | Tax Paid | Tax Assessment Tax Assessment Total Assessment is a certain percentage of the fair market value that is determined by local assessors to be the total taxable value of land and additions on the property. | Land | Improvement |
|---|---|---|---|---|
| 2025 | $9,435 | $768,396 | $476,800 | $291,596 |
| 2024 | $9,435 | $753,330 | $467,451 | $285,879 |
| 2023 | $9,255 | $738,560 | $458,286 | $280,274 |
| 2022 | $8,832 | $724,079 | $449,300 | $274,779 |
| 2021 | $8,717 | $709,883 | $440,491 | $269,392 |
| 2019 | $8,459 | $688,829 | $427,427 | $261,402 |
| 2018 | $8,340 | $675,324 | $419,047 | $256,277 |
| 2016 | $7,961 | $649,102 | $402,776 | $246,326 |
| 2015 | $7,845 | $639,352 | $396,726 | $242,626 |
| 2014 | $7,875 | $626,829 | $388,955 | $237,874 |
Source: Public Records
Map
Nearby Homes
- 23774 Burton St
- 23676 Justice St
- 8304 Mariposa Ct
- 8300 Mariposa Ct
- 23942 Schoenborn St
- 23546 Community St
- 23950 Los Rosas St
- 23716 Elkwood St
- 24004 Arminta St
- 23961 Eagle Mountain St
- 8473 Hillcroft Dr
- 8479 Hillcroft Dr
- 8366 Hillcroft Dr
- 23911 Homezell Dr
- 8350 Hillcroft Dr
- 24039 Eagle Mountain St
- 8324 Joan Ln
- 8554 Hillcroft Dr
- 8404 Joan Ln
- 8657 Valley Flores Dr
- 23741 Burton St
- 23751 Burton St
- 23757 Burton St
- 23735 Burton St
- 8235 March Ave
- 23746 Burton St
- 23763 Burton St
- 23754 Burton St
- 8227 March Ave
- 23736 Burton St
- 23727 Burton St
- 23764 Burton St
- 23730 Burton St
- 23771 Burton St
- 23701 Roscoe Blvd
- 8217 March Ave
- 23770 Burton St
- 23723 Burton St
- 23717 Fitzgerald St
- 23727 Fitzgerald St