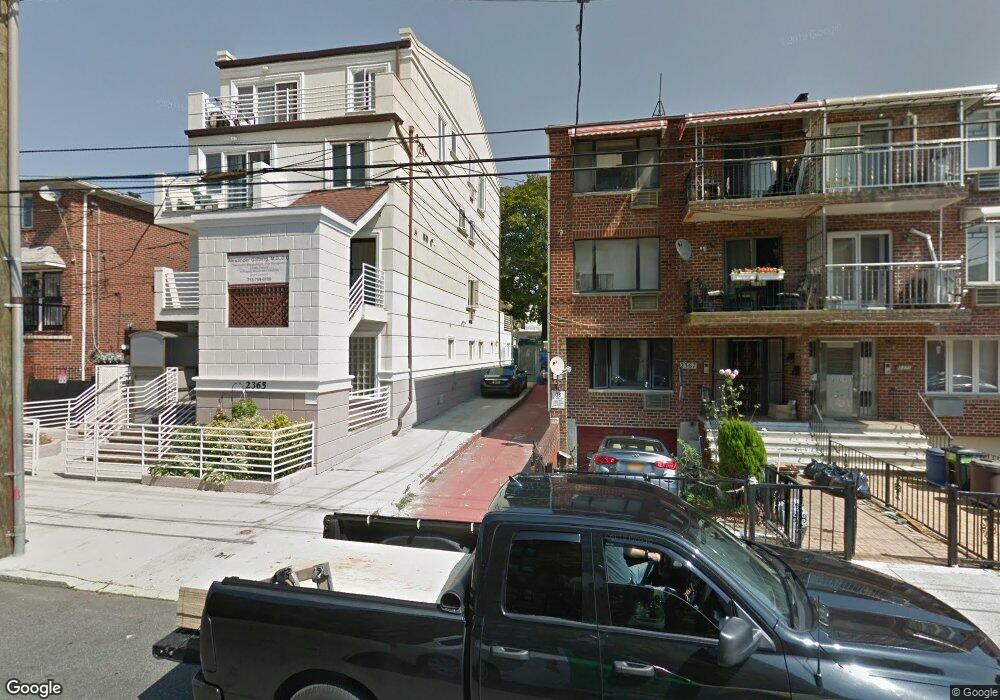
2375-2383 E 14th St Unit 3A Brooklyn, NY 11229
Sheepshead Bay NeighborhoodEstimated Value: $442,000 - $733,000
Studio
--
Bath
1,030
Sq Ft
$564/Sq Ft
Est. Value
About This Home
This home is located at 2375-2383 E 14th St Unit 3A, Brooklyn, NY 11229 and is currently estimated at $580,988, approximately $564 per square foot. 2375-2383 E 14th St Unit 3A is a home located in Kings County with nearby schools including Ps 206 Joseph F Lamb, Jhs 14 Shell Bank, and Yeshivat Or Hatorah.
Ownership History
Date
Name
Owned For
Owner Type
Purchase Details
Closed on
Jun 25, 2018
Sold by
Mordkovich Mikhail and Syrova Tatyana
Bought by
Vanshum Linda Van and Shum Yu Fan
Current Estimated Value
Home Financials for this Owner
Home Financials are based on the most recent Mortgage that was taken out on this home.
Original Mortgage
$380,000
Outstanding Balance
$323,730
Interest Rate
4.5%
Mortgage Type
New Conventional
Estimated Equity
$257,258
Purchase Details
Closed on
Jun 7, 2002
Sold by
Millennium Builders And
Bought by
Mordkovich Mikhail and Syrova Tatyana
Home Financials for this Owner
Home Financials are based on the most recent Mortgage that was taken out on this home.
Original Mortgage
$273,600
Interest Rate
6.58%
Mortgage Type
Purchase Money Mortgage
Create a Home Valuation Report for This Property
The Home Valuation Report is an in-depth analysis detailing your home's value as well as a comparison with similar homes in the area
Home Values in the Area
Average Home Value in this Area
Purchase History
We collect this data history from publicly available records. To have your information removed, we recommend requesting removal directly through your county’s website.
| Date | Buyer | Sale Price | Title Company |
|---|---|---|---|
| Vanshum Linda Van | $588,000 | -- | |
| Vanshum Linda Van | $588,000 | -- | |
| Vanshum Linda Van | $588,000 | -- | |
| Mordkovich Mikhail | -- | -- | |
| Mordkovich Mikhail | -- | -- |
Source: Public Records
Mortgage History
We collect this data history from publicly available records. To have your information removed, we recommend requesting removal directly through your county’s website.
| Date | Status | Borrower | Loan Amount |
|---|---|---|---|
| Open | Vanshum Linda Van | $380,000 | |
| Closed | Vanshum Linda Van | $380,000 | |
| Previous Owner | Mordkovich Mikhail | $273,600 |
Source: Public Records
Tax History
| Year | Tax Paid | Tax Assessment Tax Assessment Total Assessment is a certain percentage of the fair market value that is determined by local assessors to be the total taxable value of land and additions on the property. | Land | Improvement |
|---|---|---|---|---|
| 2026 | $5,235 | $38,235 | $1,965 | $36,270 |
| 2025 | $5,195 | $36,318 | $1,965 | $34,353 |
| 2024 | $5,195 | $35,073 | $1,965 | $33,108 |
| 2023 | $4,956 | $39,801 | $1,965 | $37,836 |
| 2022 | $4,596 | $36,698 | $1,965 | $34,733 |
| 2021 | $4,571 | $32,330 | $1,965 | $30,365 |
| 2019 | $4,509 | $33,904 | $1,965 | $31,939 |
| 2018 | $4,145 | $20,336 | $1,247 | $19,089 |
| 2017 | $3,268 | $19,185 | $1,269 | $17,916 |
| 2016 | $2,444 | $18,100 | $1,413 | $16,687 |
| 2015 | $467 | $18,100 | $1,639 | $16,461 |
| 2014 | $467 | $17,963 | $1,627 | $16,336 |
Source: Public Records
Map
Nearby Homes
- 2376 E 15th St
- 2408 E 13th St
- 1163 Sheepshead Bay Rd
- 2455 E 13th St
- 2437 E 15th St
- 1213 Desmond Ct
- 2299 E 13th St Unit 4E
- 2481 E 13th St
- 1200 Gravesend Neck Rd Unit 4C
- 1200 Gravesend Neck Rd Unit 4E
- 2440 E 12th St
- 2458 E 12th St
- 2427 E 17th St
- 2414 E 11th St
- 2277 Homecrest Ave Unit 6G
- 2277 Homecrest Ave Unit 6K
- 1220 Avenue Y Unit OA
- 2475 E 11th St Unit 6A
- 2475 E 11th St Unit 6H
- 2474 E 18th St
- 1319 Avenue X Unit C2
- 1319 Avenue X Unit C1
- 1317 Avenue X Unit B2
- 1317 Avenue X Unit B1
- 1317 Avenue X
- 1323 Avenue X Unit D2
- 1323 Avenue X Unit D1
- 1323 Avenue X
- 1313 Avenue X Unit A2
- 1313 Avenue X Unit A1
- 1313 Avenue X Unit 2A
- 1313 Avenue X
- 2378 E 14th St Unit 3B
- 2378 E 14th St Unit 3A
- 2378 E 14th St Unit 2B
- 2378 E 14th St Unit 2A
- 2378 E 14th St Unit 1B
- 2378 E 14th St Unit 1A
- 2378 E 14th St
- 2378 E 14th St Unit P5
Your Personal Tour Guide
Ask me questions while you tour the home.