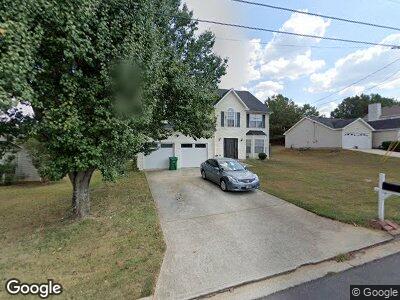
2375 Briar Knoll Rd Lithonia, GA 30058
Estimated Value: $280,000 - $319,000
4
Beds
3
Baths
2,530
Sq Ft
$116/Sq Ft
Est. Value
About This Home
This home is located at 2375 Briar Knoll Rd, Lithonia, GA 30058 and is currently estimated at $292,982, approximately $115 per square foot. 2375 Briar Knoll Rd is a home located in DeKalb County with nearby schools including Panola Way Elementary School, Miller Grove Middle School, and Miller Grove High School.
Ownership History
Date
Name
Owned For
Owner Type
Purchase Details
Closed on
Nov 14, 2022
Sold by
Staton Floyd
Bought by
Staton Floyd and Staton Tracey
Current Estimated Value
Purchase Details
Closed on
Oct 24, 2013
Sold by
Staton Chinetha Nicole
Bought by
Staton Floyd Whittington
Purchase Details
Closed on
Aug 22, 2002
Sold by
Knight Haydee and Knight Daniel K
Bought by
Staton Floyd and Staton Chinetha
Home Financials for this Owner
Home Financials are based on the most recent Mortgage that was taken out on this home.
Original Mortgage
$148,000
Interest Rate
6.4%
Mortgage Type
Stand Alone Second
Purchase Details
Closed on
Nov 22, 1999
Sold by
Daniel Loweven
Bought by
Knight Haydee and Knight Knudsen
Purchase Details
Closed on
Dec 12, 1996
Sold by
Oakvale Heights Devel Co Inc
Bought by
Daniel Haydee Loweven
Create a Home Valuation Report for This Property
The Home Valuation Report is an in-depth analysis detailing your home's value as well as a comparison with similar homes in the area
Home Values in the Area
Average Home Value in this Area
Purchase History
| Date | Buyer | Sale Price | Title Company |
|---|---|---|---|
| Staton Floyd | -- | -- | |
| Staton Floyd Whittington | -- | -- | |
| Staton Floyd | $148,000 | -- | |
| Knight Haydee | -- | -- | |
| Daniel Haydee Loweven | $116,400 | -- |
Source: Public Records
Mortgage History
| Date | Status | Borrower | Loan Amount |
|---|---|---|---|
| Open | Staton Tracey | $188,237 | |
| Previous Owner | Staton Floyd | $15,844 | |
| Previous Owner | Staton Floyd | $148,000 | |
| Previous Owner | Staton Floyd | $148,000 | |
| Closed | Daniel Haydee Loweven | $0 |
Source: Public Records
Tax History Compared to Growth
Tax History
| Year | Tax Paid | Tax Assessment Tax Assessment Total Assessment is a certain percentage of the fair market value that is determined by local assessors to be the total taxable value of land and additions on the property. | Land | Improvement |
|---|---|---|---|---|
| 2023 | $3,421 | $98,840 | $7,200 | $91,640 |
| 2022 | $2,989 | $97,440 | $7,200 | $90,240 |
| 2021 | $2,427 | $73,120 | $7,200 | $65,920 |
| 2020 | $2,094 | $62,240 | $7,200 | $55,040 |
| 2019 | $1,954 | $58,800 | $7,200 | $51,600 |
| 2018 | $1,616 | $56,240 | $4,080 | $52,160 |
| 2017 | $1,689 | $49,400 | $4,080 | $45,320 |
| 2016 | $1,526 | $45,840 | $4,080 | $41,760 |
| 2014 | $966 | $29,560 | $4,080 | $25,480 |
Source: Public Records
Map
Nearby Homes
- 2357 Wellborn Hills Place
- 5546 Wellborn Creek Dr
- 5587 Strathmoor Manor Cir
- 5586 Cannonade Ln
- 5584 Cannonade Ln
- 2098 Mallard Crest
- 5554 Wellborn Creek Dr
- 2469 Briar Knoll Rd
- 2044 Teal Cove
- 5547 Strathmoor Manor Cir
- 5536 Strathmoor Manor Cir
- 5522 Donerail St
- 5570 Downs Way
- 5897 Strathmoor Manor Cir Unit I
- 5797 Strathmoor Manor Cir
- 2271 Rolling Trail
- 5445 Mallard Trail Unit 1
- 2375 Briar Knoll Rd
- 2369 Briar Knoll Rd
- 5391 Wellborn Creek Dr
- 5397 Wellborn Creek Dr
- 5385 Wellborn Creek Dr
- 2363 Briar Knoll Rd
- 2387 Briar Knoll Rd
- 5403 Wellborn Creek Dr
- 5640 Glen Ridge Bend
- 5409 Wellborn Creek Dr Unit 2
- 5381 Wellborn Creek Dr Unit 2
- 2357 Briar Knoll Rd
- 5637 Glen Ridge Bend
- 5415 Wellborn Creek Dr
- 5634 Glen Ridge Bend
- 2393 Briar Knoll Rd
- 5390 Wellborn Creek Dr
- 5379 Wellborn Creek Dr Unit 2
- 5400 Wellborn Creek Dr Unit 2
- 5384 Wellborn Creek Dr