2375 Cascade Lakes Cir SE Unit 41 Grand Rapids, MI 49546
Estimated Value: $762,000 - $963,000
5
Beds
5
Baths
4,044
Sq Ft
$219/Sq Ft
Est. Value
About This Home
This home is located at 2375 Cascade Lakes Cir SE Unit 41, Grand Rapids, MI 49546 and is currently estimated at $887,033, approximately $219 per square foot. 2375 Cascade Lakes Cir SE Unit 41 is a home located in Kent County with nearby schools including Thornapple Elementary School, Central Woodlands 5/6 School, and Central Middle School.
Ownership History
Date
Name
Owned For
Owner Type
Purchase Details
Closed on
Sep 11, 2014
Sold by
Coles Jason P and Coles Elizabeth Ashimine
Bought by
The Coles Family Trust
Current Estimated Value
Purchase Details
Closed on
Feb 25, 2011
Sold by
Gill Donald H and Donald H Gill Trust
Bought by
Coles Jason and Coles Elizabeth
Home Financials for this Owner
Home Financials are based on the most recent Mortgage that was taken out on this home.
Original Mortgage
$351,600
Outstanding Balance
$241,242
Interest Rate
4.76%
Mortgage Type
New Conventional
Estimated Equity
$645,791
Purchase Details
Closed on
Sep 22, 2009
Sold by
Gill Donald H and Gill Silvia S
Bought by
Donald H Gill Trust and Silvia S Gill Trust
Purchase Details
Closed on
Jan 9, 1998
Sold by
Gill Donald H
Bought by
Coles Jason & Elizabeth
Purchase Details
Closed on
Oct 4, 1996
Bought by
Nagelkirk Harold and Coles Jason
Create a Home Valuation Report for This Property
The Home Valuation Report is an in-depth analysis detailing your home's value as well as a comparison with similar homes in the area
Home Values in the Area
Average Home Value in this Area
Purchase History
| Date | Buyer | Sale Price | Title Company |
|---|---|---|---|
| The Coles Family Trust | -- | None Available | |
| Coles Jason | $439,500 | Grand Rapids Title Co Llc | |
| Donald H Gill Trust | -- | None Available | |
| Coles Jason & Elizabeth | $78,000 | -- | |
| Nagelkirk Harold | $168,000 | -- |
Source: Public Records
Mortgage History
| Date | Status | Borrower | Loan Amount |
|---|---|---|---|
| Open | Coles Jason | $351,600 |
Source: Public Records
Tax History Compared to Growth
Tax History
| Year | Tax Paid | Tax Assessment Tax Assessment Total Assessment is a certain percentage of the fair market value that is determined by local assessors to be the total taxable value of land and additions on the property. | Land | Improvement |
|---|---|---|---|---|
| 2025 | $5,915 | $410,600 | $0 | $0 |
| 2024 | $5,915 | $352,600 | $0 | $0 |
| 2023 | $8,283 | $284,800 | $0 | $0 |
| 2022 | $8,015 | $285,800 | $0 | $0 |
| 2021 | $7,814 | $287,700 | $0 | $0 |
| 2020 | $5,281 | $263,200 | $0 | $0 |
| 2019 | $7,765 | $258,100 | $0 | $0 |
| 2018 | $7,664 | $238,100 | $0 | $0 |
| 2017 | $7,636 | $231,400 | $0 | $0 |
| 2016 | $7,370 | $232,300 | $0 | $0 |
| 2015 | -- | $232,300 | $0 | $0 |
| 2013 | -- | $222,100 | $0 | $0 |
Source: Public Records
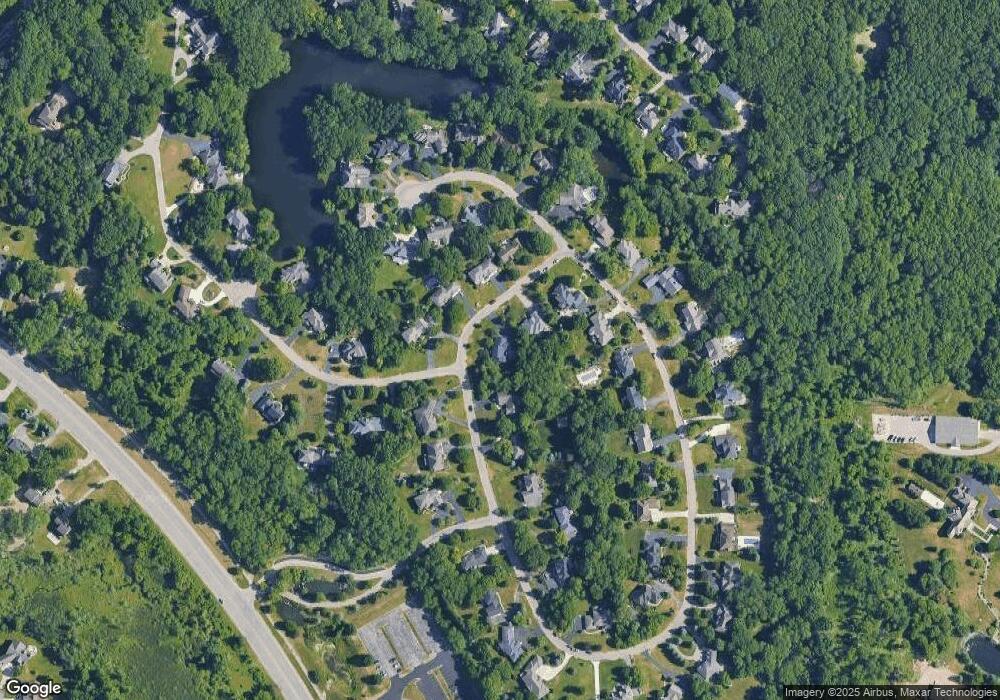
Map
Nearby Homes
- 6761 Burton St SE
- 6716 Cascade Rd SE Unit 46
- 1835 Linson Ct SE
- 6334 Bechalla Dr SE
- 6663 Waybridge Dr SE Unit 37
- 6657 Waybridge Dr SE
- 6587 Waybridge Dr SE
- 2726 Orange Ave SE
- 2444 Irene Ave SE
- 2757 Cascade Springs Dr SE
- 6574 Round Hill Ct SE Unit Lot 5
- 6574 Round Hill Ct SE
- 6562 Round Hill Ct SE
- 6562 Round Hill Ct SE Unit Lot 6
- 6554 Round Hill Ct SE
- 6554 Round Hill Ct SE Unit Lot 7
- 6030 Champagne Ct SE
- 2594 Tall Timber Ct SE
- 2984 Chapshire Dr SE Unit 59
- 5808 Manchester Hills Dr SE
- 2391 Cascade Lakes Cir SE Unit 40
- 2369 Cascade Lakes Cir SE
- 2382 Cascade Lakes Cir SE
- 2376 Cascade Lakes Cir SE
- 2390 Cascade Lakes Cir SE Unit 32
- 2368 Cascade Lakes Cir SE
- 2145 Cascade Lakes Cir SE Unit 55
- 2127 Cascade Lakes Cir SE
- 2169 Cascade Lakes Cir SE
- 6794 Cascade Lakes Ct SE
- 2102 Cascade Lakes Cir
- 2181 Cascade Lakes Cir SE Unit 53
- 6714 Cascade Lakes Ct SE
- 2360 Cascade Lakes Cir SE
- 6699 Avonlea Ct SE
- 2353 Cascade Lakes Cir SE
- 6708 Cascade Lakes Ct SE Unit 28
- 6750 Cascade Lakes Ct SE Unit 30
- 6700 Avonlea Ct SE
- 2197 Cascade Lakes Cir SE Unit 52