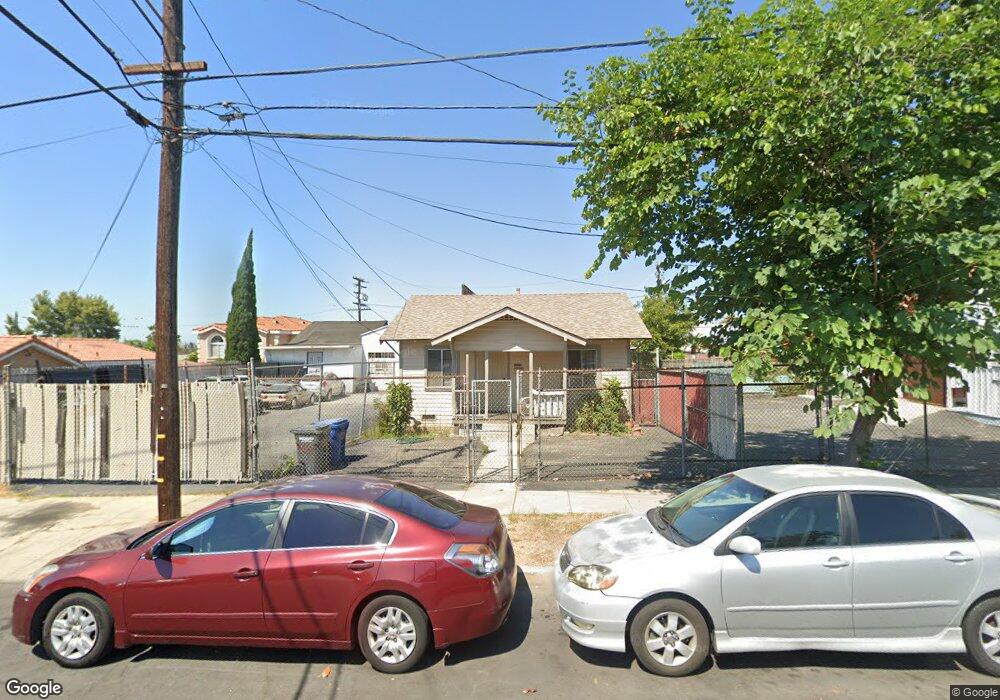
2375 Lewis Ave Signal Hill, CA 90755
Estimated Value: $1,606,342
--
Bed
--
Bath
5,568
Sq Ft
$288/Sq Ft
Est. Value
About This Home
This home is located at 2375 Lewis Ave, Signal Hill, CA 90755 and is currently estimated at $1,606,342, approximately $288 per square foot. 2375 Lewis Ave is a home located in Los Angeles County with nearby schools including Signal Hill Elementary School, Nelson Academy, and Long Beach Polytechnic High School.
Ownership History
Date
Name
Owned For
Owner Type
Purchase Details
Closed on
Jan 21, 2025
Sold by
Or Richon Llc
Bought by
Or Richon Llc
Current Estimated Value
Home Financials for this Owner
Home Financials are based on the most recent Mortgage that was taken out on this home.
Original Mortgage
$850,000
Outstanding Balance
$844,233
Interest Rate
6.93%
Mortgage Type
New Conventional
Estimated Equity
$762,109
Purchase Details
Closed on
Nov 4, 2020
Sold by
Goverman Nadejda Vladimirovna
Bought by
Goverman Aviad
Purchase Details
Closed on
Aug 28, 2020
Sold by
Mackinga Sandra Lynn and Johnson Deborah Jean
Bought by
Goverman Aviad
Home Financials for this Owner
Home Financials are based on the most recent Mortgage that was taken out on this home.
Original Mortgage
$950,000
Interest Rate
2.9%
Mortgage Type
Commercial
Purchase Details
Closed on
Mar 14, 2019
Sold by
Mackinga Sandra Lynn and Johnson Deborah Jean
Bought by
Mackinga Sandra Lynn and Johnson Deborah Jean
Create a Home Valuation Report for This Property
The Home Valuation Report is an in-depth analysis detailing your home's value as well as a comparison with similar homes in the area
Home Values in the Area
Average Home Value in this Area
Purchase History
| Date | Buyer | Sale Price | Title Company |
|---|---|---|---|
| Or Richon Llc | -- | Chicago Title Company | |
| Goverman Aviad | -- | Chicago Title Company | |
| Goverman Aviad | $1,250,000 | Chicago Title Company | |
| Mackinga Sandra Lynn | -- | None Available |
Source: Public Records
Mortgage History
| Date | Status | Borrower | Loan Amount |
|---|---|---|---|
| Open | Or Richon Llc | $850,000 | |
| Previous Owner | Goverman Aviad | $950,000 |
Source: Public Records
Tax History Compared to Growth
Tax History
| Year | Tax Paid | Tax Assessment Tax Assessment Total Assessment is a certain percentage of the fair market value that is determined by local assessors to be the total taxable value of land and additions on the property. | Land | Improvement |
|---|---|---|---|---|
| 2025 | $19,153 | $1,406,099 | $1,146,104 | $259,995 |
| 2024 | $19,153 | $1,378,530 | $1,123,632 | $254,898 |
| 2023 | $18,846 | $1,351,500 | $1,101,600 | $249,900 |
| 2022 | $17,748 | $1,325,000 | $1,080,000 | $245,000 |
| 2021 | $16,812 | $1,250,000 | $1,020,000 | $230,000 |
| 2020 | $3,565 | $137,615 | $62,713 | $74,902 |
| 2019 | $3,539 | $134,918 | $61,484 | $73,434 |
| 2018 | $3,096 | $132,274 | $60,279 | $71,995 |
| 2016 | $2,866 | $127,140 | $57,940 | $69,200 |
| 2015 | $2,803 | $125,231 | $57,070 | $68,161 |
| 2014 | $2,812 | $122,779 | $55,953 | $66,826 |
Source: Public Records
Map
Nearby Homes
- 2225 Olive Ave
- 2370 Lime Ave
- 2366 Linden Ave
- 2051 Orange Ave
- 1211 E Leigh Ct
- 1015 E 20th St
- 2310 Elm Ave
- 509 E 21st St
- 2240 Walnut Ave
- 1460 E Willow St Unit 202
- 2238 Walnut Ave
- 2599 Walnut Ave
- 2093 Pasadena Ave
- 2420 Gaviota Ave
- 2430 Gaviota Ave
- 2337 Long Beach Blvd
- 1872 Lemon Ave
- 2655 Walnut Ave
- 211 1/2 E Eagle St
- 1843 Cerritos Ave
- 2361 Lewis Ave
- 1010 E Burnett St
- 1000 E Burnett St Unit 4
- 1000 E Burnett St Unit I4
- 1000 E Burnett St
- 2357 Lewis Ave
- 1020 E Burnett St
- 2351 Lewis Ave
- 1030 E Burnett St
- 2341 Lewis Ave
- 2392 Lewis Ave
- 2335 Lewis Ave
- 2370 Lewis Ave
- 2364 Lewis Ave
- 2360 Lewis Ave
- 1036 E Burnett St
- 2329 Lewis Ave
- 2336 Lewis Ave
- 1005 E Burnett St
- 2354 Lewis Ave Unit 56