Estimated Value: $999,000 - $1,500,000
7
Beds
5
Baths
3,960
Sq Ft
$292/Sq Ft
Est. Value
About This Home
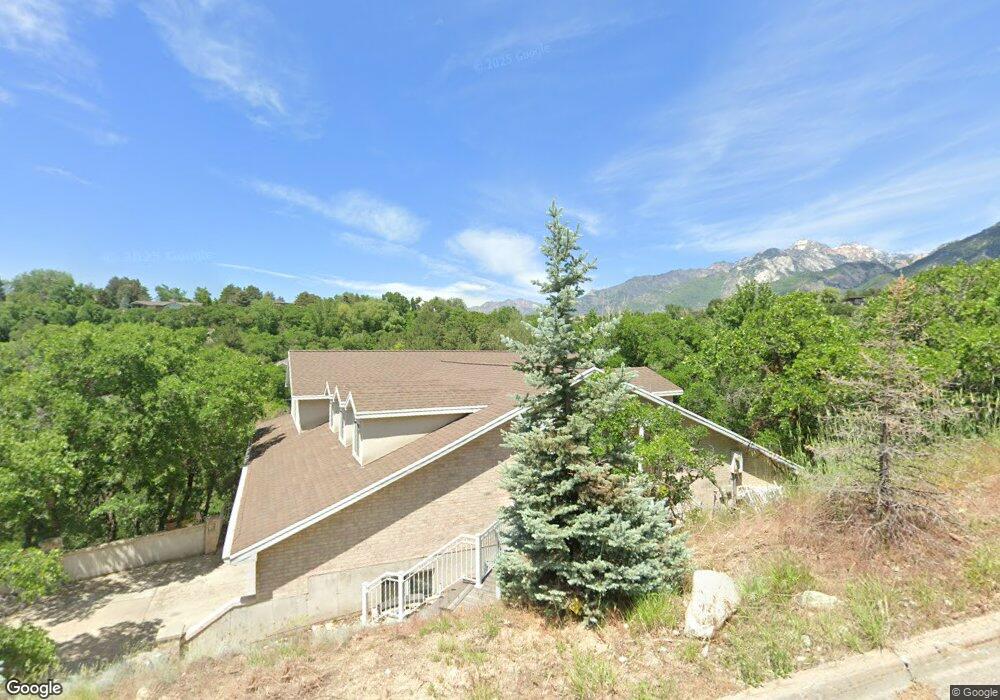
This home is located at 2375 Willow Brook Way, Sandy, UT 84092 and is currently estimated at $1,157,747, approximately $292 per square foot. 2375 Willow Brook Way is a home located in Salt Lake County with nearby schools including Bell Canyon Montessori School and Challenger School - Sandy.
Ownership History
Date
Name
Owned For
Owner Type
Purchase Details
Closed on
Oct 2, 2025
Sold by
Lamont Wardle Living Trust and Wardle Lamont
Bought by
Lamont Wardle Living Trust and Wardle
Current Estimated Value
Purchase Details
Closed on
Jun 3, 2022
Sold by
Lamont Wardle
Bought by
Lamont Wardle Living Trust
Purchase Details
Closed on
Apr 6, 1998
Sold by
Wardle Harold Don and Wardle Helen Louise
Bought by
Wardle Lamont and Wardle Margaret F
Home Financials for this Owner
Home Financials are based on the most recent Mortgage that was taken out on this home.
Original Mortgage
$80,000
Interest Rate
7%
Purchase Details
Closed on
Apr 2, 1998
Sold by
Medallion Industries
Bought by
Wardle Lamont and Wardle Margaret F
Home Financials for this Owner
Home Financials are based on the most recent Mortgage that was taken out on this home.
Original Mortgage
$80,000
Interest Rate
7%
Purchase Details
Closed on
Sep 30, 1994
Sold by
Wardle Harold Don and Wardle Helen Louise
Bought by
Wardle Lamont and Wardle Margaret
Purchase Details
Closed on
Aug 5, 1987
Sold by
Lauper Ivan E and Lauper Mary Helen
Bought by
Wardle Harold Don and Wardle Helen Louise
Create a Home Valuation Report for This Property
The Home Valuation Report is an in-depth analysis detailing your home's value as well as a comparison with similar homes in the area
Home Values in the Area
Average Home Value in this Area
Purchase History
| Date | Buyer | Sale Price | Title Company |
|---|---|---|---|
| Lamont Wardle Living Trust | -- | None Listed On Document | |
| Lamont Wardle Living Trust | -- | None Listed On Document | |
| Wardle Lamont | -- | -- | |
| Wardle Lamont | -- | -- | |
| Wardle Lamont | -- | -- | |
| Wardle Harold Don | -- | -- |
Source: Public Records
Mortgage History
| Date | Status | Borrower | Loan Amount |
|---|---|---|---|
| Previous Owner | Wardle Lamont | $80,000 |
Source: Public Records
Tax History Compared to Growth
Tax History
| Year | Tax Paid | Tax Assessment Tax Assessment Total Assessment is a certain percentage of the fair market value that is determined by local assessors to be the total taxable value of land and additions on the property. | Land | Improvement |
|---|---|---|---|---|
| 2025 | -- | $863,500 | $319,200 | $544,300 |
| 2024 | -- | $807,800 | $307,300 | $500,500 |
| 2023 | $1,352 | $810,100 | $295,500 | $514,600 |
| 2022 | $1,352 | $759,800 | $263,300 | $496,500 |
| 2021 | $2,895 | $594,300 | $203,100 | $391,200 |
| 2020 | $3,079 | $544,100 | $203,100 | $341,000 |
| 2019 | $2,972 | $515,800 | $191,700 | $324,100 |
| 2018 | $2,674 | $487,000 | $167,600 | $319,400 |
| 2017 | $2,450 | $436,200 | $167,600 | $268,600 |
| 2016 | $2,427 | $420,900 | $162,200 | $258,700 |
| 2015 | $3,837 | $463,100 | $208,200 | $254,900 |
| 2014 | $3,694 | $454,000 | $142,200 | $311,800 |
Source: Public Records
Map
Nearby Homes
- 98 E Lone Hollow Dr S Unit 902
- 2234 E Willow Brook Way
- 15 Lone Hollow Dr
- 18 Snow Forest Ln
- 1 Cross Hill Ln
- 5 Quietwood Ln
- 89 Lone Hollow Dr Unit 1026
- 2022 Tall Pines Way
- 3 Snow Forest Cove Unit 1039
- 39 Northridge Way
- 11458 Lexington Hills Dr
- 11551 S Woodhampton Dr Unit 2
- 1 Pepperwood Pointe
- 15 Bentwood Ln S Unit 1117
- 81 E Lone Hollow
- 11 Bent Hollow Ln Unit 1141
- 10665 S 2340 E
- 1937 Wasatch Blvd
- 2058 E Oak Manor Dr
- 6 Bent Hollow Ln Unit 1147
- 2357 Willow Brook Way
- 2387 Willow Brook Way
- 2355 Willow View Way
- 2369 Willow View Way
- 2345 Willow Brook Way
- 2345 E Willow Brook Way
- 23 Lone Hollow Dr
- 23 Lone Hollow
- 2391 Willow View Way
- 2403 Willow Brook Way
- 24 Lone Hollow Dr
- 23 Lone Hollow Dr
- 2342 E Willow Brook Way
- 2342 Willow Brook Way
- 23 E Lone Hollow
- 2409 Willow View Way
- 2409 E Willow View Way
- 25 Lone Hollow Dr
- 25 Lone Hollow
- 2329 Willow Brook Way