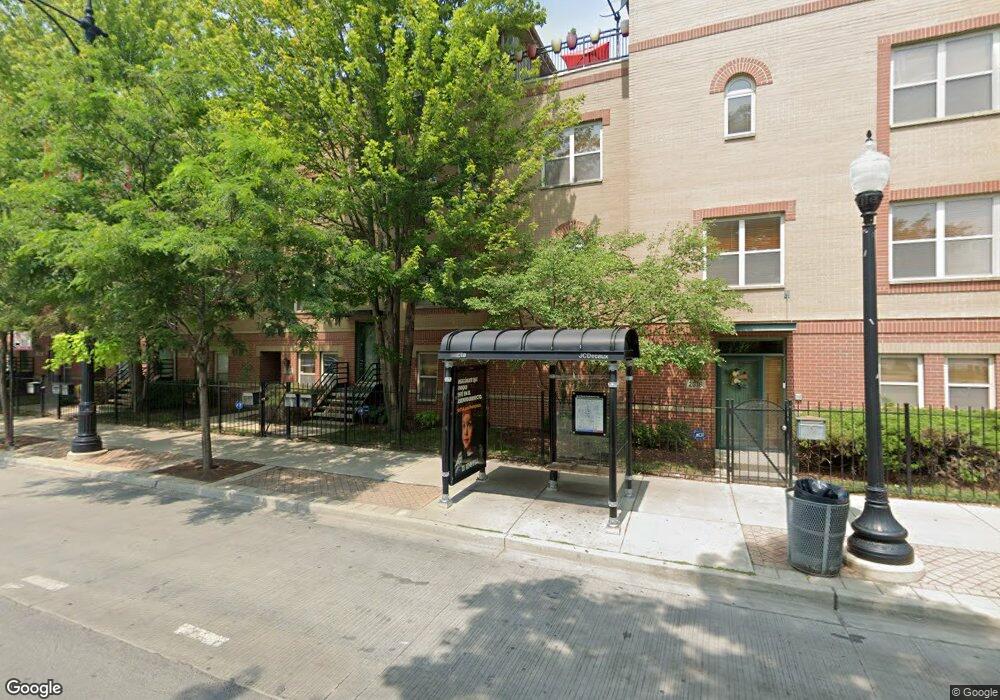
2376 E 71st St Unit 9 Chicago, IL 60649
South Shore NeighborhoodEstimated Value: $265,000 - $299,000
Studio
--
Bath
--
Sq Ft
92,521
Sq Ft Lot
About This Home
This home is located at 2376 E 71st St Unit 9, Chicago, IL 60649 and is currently estimated at $278,765. 2376 E 71st St Unit 9 is a home located in Cook County with nearby schools including Okeeffe Elementary School and St Philip Neri Elementary School.
Ownership History
Date
Name
Owned For
Owner Type
Purchase Details
Closed on
May 20, 2024
Sold by
Harris Sarah Levi Elizabeth
Bought by
Mccormick Shannon and Mccormick Stephen James
Current Estimated Value
Home Financials for this Owner
Home Financials are based on the most recent Mortgage that was taken out on this home.
Original Mortgage
$261,250
Outstanding Balance
$256,952
Interest Rate
6.99%
Mortgage Type
New Conventional
Estimated Equity
$21,813
Purchase Details
Closed on
Aug 28, 2006
Sold by
Woods Cleophus C
Bought by
Harris Sarah
Home Financials for this Owner
Home Financials are based on the most recent Mortgage that was taken out on this home.
Original Mortgage
$220,000
Interest Rate
6.25%
Mortgage Type
Unknown
Purchase Details
Closed on
Sep 30, 2002
Sold by
Lakeshore Pointe Llc
Bought by
Edwards Aletha
Home Financials for this Owner
Home Financials are based on the most recent Mortgage that was taken out on this home.
Original Mortgage
$331,200
Interest Rate
8.25%
Create a Home Valuation Report for This Property
The Home Valuation Report is an in-depth analysis detailing your home's value as well as a comparison with similar homes in the area
Home Values in the Area
Average Home Value in this Area
Purchase History
| Date | Buyer | Sale Price | Title Company |
|---|---|---|---|
| Mccormick Shannon | $275,000 | Proper Title | |
| Harris Sarah | $275,000 | Ticor Title Ins Co 2002 | |
| Edwards Aletha | $368,000 | -- |
Source: Public Records
Mortgage History
| Date | Status | Borrower | Loan Amount |
|---|---|---|---|
| Open | Mccormick Shannon | $261,250 | |
| Previous Owner | Harris Sarah | $220,000 | |
| Previous Owner | Edwards Aletha | $331,200 |
Source: Public Records
Tax History
| Year | Tax Paid | Tax Assessment Tax Assessment Total Assessment is a certain percentage of the fair market value that is determined by local assessors to be the total taxable value of land and additions on the property. | Land | Improvement |
|---|---|---|---|---|
| 2025 | $5,069 | $27,084 | $2,797 | $24,287 |
| 2024 | $5,069 | $27,084 | $2,797 | $24,287 |
| 2023 | $4,819 | $22,000 | $2,256 | $19,744 |
| 2022 | $4,819 | $22,000 | $2,256 | $19,744 |
| 2021 | $4,728 | $21,999 | $2,255 | $19,744 |
| 2020 | $3,874 | $17,176 | $2,255 | $14,921 |
| 2019 | $3,886 | $18,961 | $2,255 | $16,706 |
| 2018 | $3,795 | $18,961 | $2,255 | $16,706 |
| 2017 | $3,685 | $17,343 | $1,984 | $15,359 |
| 2016 | $3,633 | $17,343 | $1,984 | $15,359 |
| 2015 | $3,276 | $17,343 | $1,984 | $15,359 |
| 2014 | $2,716 | $14,706 | $1,624 | $13,082 |
| 2013 | $2,672 | $14,706 | $1,624 | $13,082 |
Source: Public Records
Map
Nearby Homes
- 2348 E 71st St Unit P18
- 2348 E 71st St Unit P-44
- 7003 S Oglesby Ave
- 2234 E 70th Place Unit 1
- 2230 E 70th Place Unit 204
- 2233 E 70th Place Unit 1
- 7209 S Yates Blvd Unit 72092B
- 7220 S Yates Blvd
- 6935 S Crandon Ave Unit 8D
- 7219 S Yates Blvd Unit 72193A
- 7235 S Exchange Ave
- 7237 S Exchange Ave
- 2212 E 70th St Unit 3A
- 2212 E 70th St Unit 2D
- 2212 E 70th St Unit 1B
- 2321 E 69th St Unit 2
- 7020 S Paxton Ave Unit 1S
- 6926 S Paxton Ave Unit 1S
- 6926 S Paxton Ave Unit 1N
- 6832 S South Shore Dr Unit 1
- 2376 E 71st St Unit 10D
- 2376 E 71st St Unit 10
- 2376 E 71st St Unit 1
- 2376 E 71st St Unit D
- 2374 E 71st St Unit 2
- 2374 E 71st St
- 2374 E 71st St Unit 2
- 2374 E 71st St
- 2374 E 71st St Unit 2
- 2374 E 71st St Unit P43
- 2372 E 71st St Unit 2372
- 2372 E 71st St Unit P41
- 2372 E 71st St Unit 12
- 2372 E 71st St Unit 1
- 2370 E 71st St Unit 16G
- 2370 E 71st St Unit P44
- 2370 E 71st St Unit 2372
- 2370 E 71st St Unit 2370
- 2370 E 71st St Unit 2370
- 2370 E 71st St Unit 16G
Your Personal Tour Guide
Ask me questions while you tour the home.