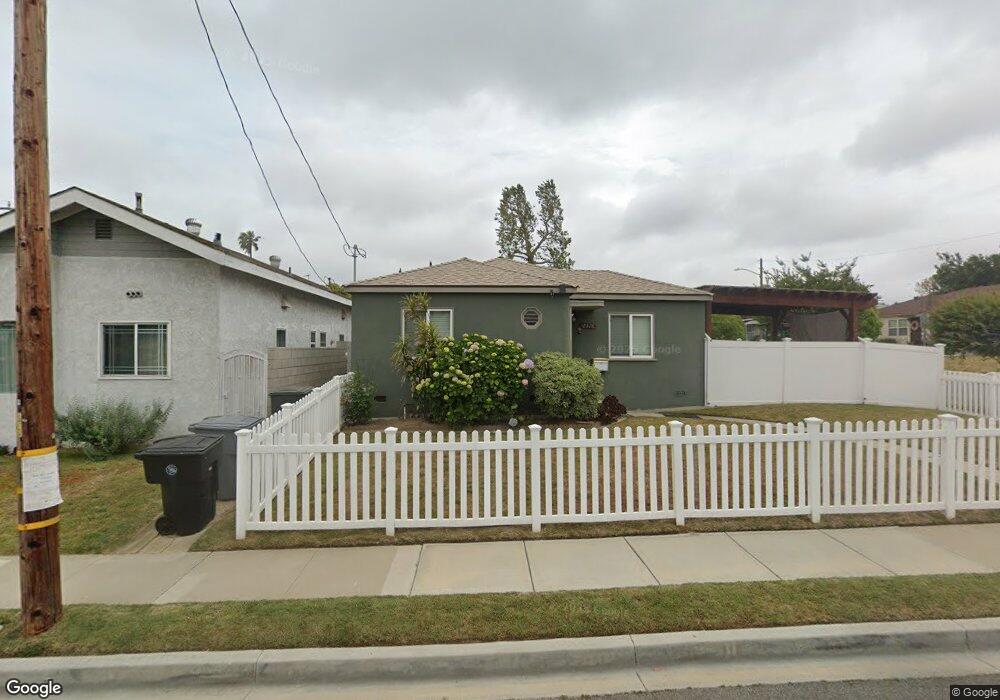
2376 Maricopa Place Torrance, CA 90501
East Torrance NeighborhoodEstimated Value: $839,000 - $1,041,000
3
Beds
1
Bath
1,242
Sq Ft
$777/Sq Ft
Est. Value
About This Home
This home is located at 2376 Maricopa Place, Torrance, CA 90501 and is currently estimated at $964,928, approximately $776 per square foot. 2376 Maricopa Place is a home located in Los Angeles County with nearby schools including Fern Elementary School, Madrona Middle School, and Torrance High School.
Ownership History
Date
Name
Owned For
Owner Type
Purchase Details
Closed on
Jun 12, 2000
Sold by
Johnson Adele T
Bought by
Brumley Larry M and Brumley Beverly A
Current Estimated Value
Home Financials for this Owner
Home Financials are based on the most recent Mortgage that was taken out on this home.
Original Mortgage
$160,000
Outstanding Balance
$57,383
Interest Rate
8.67%
Mortgage Type
Seller Take Back
Estimated Equity
$907,545
Purchase Details
Closed on
Oct 27, 1998
Sold by
Johnson Adele T
Bought by
Johnson Adele T and The John Trust
Home Financials for this Owner
Home Financials are based on the most recent Mortgage that was taken out on this home.
Original Mortgage
$148,900
Interest Rate
6.61%
Purchase Details
Closed on
Jan 9, 1995
Sold by
Johnson Adele T
Bought by
Johnson Adele T and Johnson Trust
Create a Home Valuation Report for This Property
The Home Valuation Report is an in-depth analysis detailing your home's value as well as a comparison with similar homes in the area
Home Values in the Area
Average Home Value in this Area
Purchase History
| Date | Buyer | Sale Price | Title Company |
|---|---|---|---|
| Brumley Larry M | $200,000 | Stewart Title | |
| Johnson Adele T | -- | -- | |
| Johnson Adele T | -- | Lawyers Title | |
| Johnson Adele T | -- | -- |
Source: Public Records
Mortgage History
| Date | Status | Borrower | Loan Amount |
|---|---|---|---|
| Open | Brumley Larry M | $160,000 | |
| Previous Owner | Johnson Adele T | $148,900 |
Source: Public Records
Tax History Compared to Growth
Tax History
| Year | Tax Paid | Tax Assessment Tax Assessment Total Assessment is a certain percentage of the fair market value that is determined by local assessors to be the total taxable value of land and additions on the property. | Land | Improvement |
|---|---|---|---|---|
| 2025 | $3,727 | $307,371 | $245,906 | $61,465 |
| 2024 | $3,727 | $301,345 | $241,085 | $60,260 |
| 2023 | $3,662 | $295,437 | $236,358 | $59,079 |
| 2022 | $3,614 | $289,645 | $231,724 | $57,921 |
| 2021 | $3,543 | $283,967 | $227,181 | $56,786 |
| 2020 | $3,492 | $281,056 | $224,852 | $56,204 |
| 2019 | $3,444 | $275,546 | $220,444 | $55,102 |
| 2018 | $3,314 | $270,144 | $216,122 | $54,022 |
| 2016 | $3,161 | $259,656 | $207,731 | $51,925 |
| 2015 | $3,093 | $255,757 | $204,611 | $51,146 |
| 2014 | $3,020 | $250,748 | $200,603 | $50,145 |
Source: Public Records
Map
Nearby Homes
- 625 Amapola Ave
- 2363 Torrance Blvd
- 2558 Torrance Blvd
- 1021 Cravens Ave Unit 9
- 1508 Beech Ave
- 2265 Del Amo Blvd
- 2213 Del Amo Blvd
- 914 Fonthill Ave
- 1281 Cabrillo Ave Unit 306
- 1281 Cabrillo Ave Unit 303
- 1534 Marcelina Ave Unit B
- 1800 Oak St Unit 200
- 1633 Hickory Ave
- 2567 Plaza Del Amo Unit 109
- 2571 Plaza Del Amo Unit 310
- 2571 Plaza Del Amo Unit 107
- 2303 Jefferson St Unit 1215
- 1014 Maple Ave
- 2367 Jefferson St Unit 112
- 2555 Plaza Del Amo Unit R
- 2372 Maricopa Place
- 708 Acacia Ave
- 2368 Maricopa Place
- 705 Acacia Ave
- 712 Acacia Ave
- 2375 Maricopa Place
- 703 Acacia Ave Unit 703 Acacia
- 703 Acacia Ave
- 2371 Maricopa Place
- 617 Acacia Ave
- 716 Acacia Ave
- 2367 Maricopa Place
- 613 Acacia Ave
- 711 Acacia Ave
- 2362 Maricopa Place
- 720 Acacia Ave
- 2363 Maricopa Place
- 708 Pine Dr
- 607 Acacia Ave
- 606 Acacia Ave