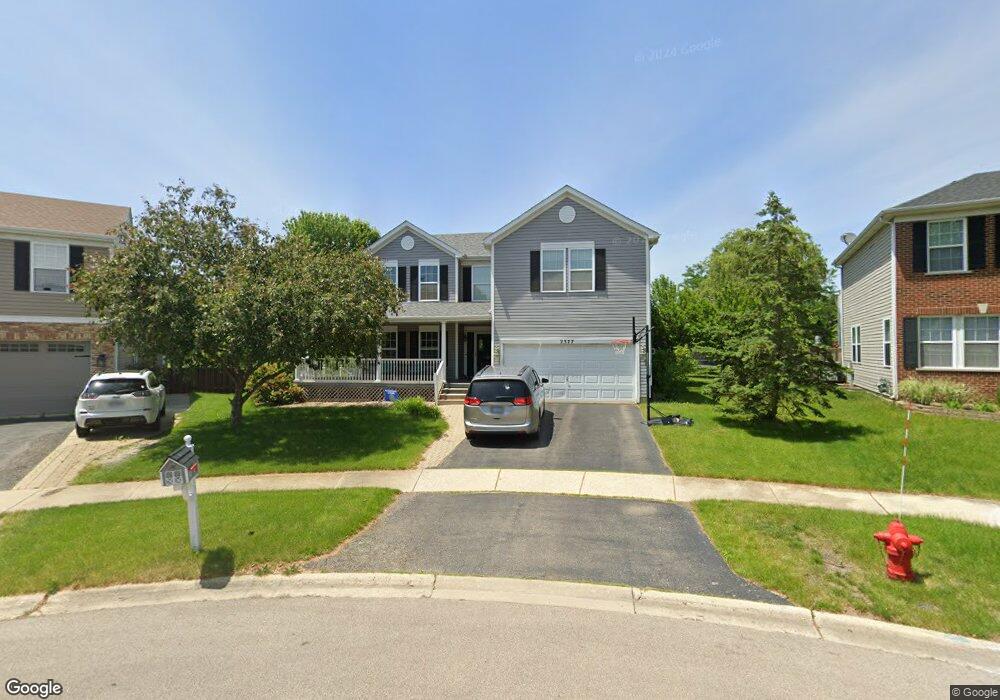
2377 Bellingham Ct Aurora, IL 60503
Far Southeast NeighborhoodEstimated Value: $529,218 - $557,000
4
Beds
3
Baths
3,550
Sq Ft
$153/Sq Ft
Est. Value
About This Home
This home is located at 2377 Bellingham Ct, Aurora, IL 60503 and is currently estimated at $542,055, approximately $152 per square foot. 2377 Bellingham Ct is a home located in Will County with nearby schools including The Wheatlands Elementary School, Bednarcik Jr. High School, and Oswego East High School.
Ownership History
Date
Name
Owned For
Owner Type
Purchase Details
Closed on
Sep 10, 2009
Sold by
Prinzing Thomas and Prinzing Jane
Bought by
Adams Robert M and Adams Janice E
Current Estimated Value
Home Financials for this Owner
Home Financials are based on the most recent Mortgage that was taken out on this home.
Original Mortgage
$230,160
Outstanding Balance
$151,970
Interest Rate
5.38%
Mortgage Type
New Conventional
Estimated Equity
$390,085
Purchase Details
Closed on
Nov 25, 2008
Sold by
Millard Russell D and Millard Alysha M
Bought by
Prinzing Thomas and Prinzing Jane
Purchase Details
Closed on
Oct 8, 2001
Sold by
Kennedy Homes Ltd Partnership
Bought by
Millard Russ D and Millard Alysha M
Home Financials for this Owner
Home Financials are based on the most recent Mortgage that was taken out on this home.
Original Mortgage
$155,000
Interest Rate
6.92%
Create a Home Valuation Report for This Property
The Home Valuation Report is an in-depth analysis detailing your home's value as well as a comparison with similar homes in the area
Home Values in the Area
Average Home Value in this Area
Purchase History
| Date | Buyer | Sale Price | Title Company |
|---|---|---|---|
| Adams Robert M | $288,000 | Atg | |
| Prinzing Thomas | $350,000 | Atg | |
| Millard Russ D | $279,500 | First American Title |
Source: Public Records
Mortgage History
| Date | Status | Borrower | Loan Amount |
|---|---|---|---|
| Open | Adams Robert M | $230,160 | |
| Previous Owner | Millard Russ D | $155,000 |
Source: Public Records
Tax History
| Year | Tax Paid | Tax Assessment Tax Assessment Total Assessment is a certain percentage of the fair market value that is determined by local assessors to be the total taxable value of land and additions on the property. | Land | Improvement |
|---|---|---|---|---|
| 2024 | $11,847 | $143,919 | $30,881 | $113,038 |
| 2023 | $11,847 | $127,137 | $27,280 | $99,857 |
| 2022 | $11,357 | $114,963 | $25,805 | $89,158 |
| 2021 | $10,780 | $109,488 | $24,576 | $84,912 |
| 2020 | $10,321 | $107,754 | $24,187 | $83,567 |
| 2019 | $10,432 | $104,717 | $23,505 | $81,212 |
| 2018 | $10,883 | $105,477 | $22,988 | $82,489 |
| 2017 | $10,706 | $102,754 | $22,395 | $80,359 |
| 2016 | $10,734 | $100,542 | $21,913 | $78,629 |
| 2015 | $10,530 | $96,675 | $21,070 | $75,605 |
| 2014 | $10,530 | $88,090 | $20,720 | $67,370 |
| 2013 | $10,530 | $88,090 | $20,720 | $67,370 |
Source: Public Records
Map
Nearby Homes
- 3237 Peyton Cir
- 3235 Kimblewick Cir
- 3284 Mallory Creek Ln
- 1893 Indian Hill Ln Unit 4053
- 10140 S Eola Rd
- 1703 Baler Ave
- 1734 Baler Ave
- 1721 Stable Ln
- 1727 Stable Ln
- 1691 Baler Ave
- 1697 Baler Ave
- 1722 Baler Ave
- 1728 Baler Ave
- 1709 Baler Ave
- 2495 Hafenrichter Rd
- 2382 Shiloh Dr
- 1975 Misty Ridge Ct Unit 1-1
- 2084 Canyon Creek Ct
- 2325 Georgetown Cir Unit 191
- 2208 Grand Pointe Trail
- 2387 Bellingham Ct Unit 5
- 2325 Boxford Ln Unit 5
- 2367 Bellingham Ct
- 2394 Bellingham Ct
- 2394 Bellingham Ct
- 2315 Boxford Ln Unit 5
- 0 Canyon Ct
- 2227 Marshfield Ln
- 2384 Bellingham Ct Unit 5
- 2374 Bellingham Ct
- 2328 Boxford Ln Unit 5
- 2348 Boxford Ln Unit 5
- 2364 Bellingham Ct Unit 5
- 2215 Marshfield Ln
- 2354 Bellingham Ln
- 2203 Cool Creek Ct
- 2308 Boxford Ln
- 2337 Bellingham Ln
- 2295 Boxford Ct Unit 5
- 2344 Bellingham Ln Unit 5
Your Personal Tour Guide
Ask me questions while you tour the home.