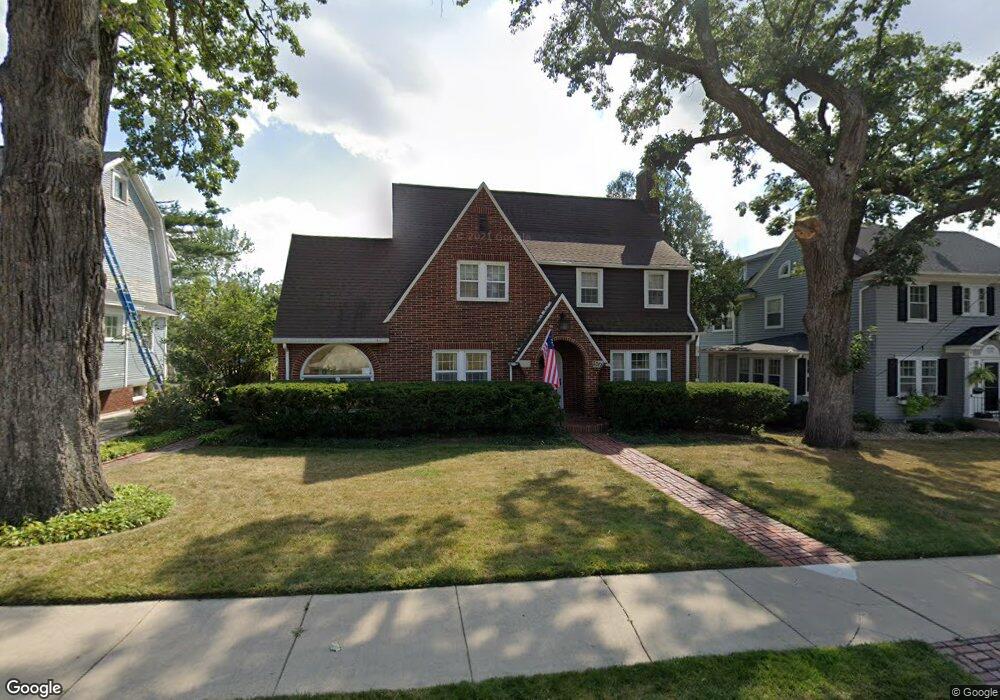
2377 Blake Blvd SE Cedar Rapids, IA 52403
Bever Park NeighborhoodEstimated Value: $295,000 - $319,404
3
Beds
3
Baths
1,900
Sq Ft
$161/Sq Ft
Est. Value
About This Home
This home is located at 2377 Blake Blvd SE, Cedar Rapids, IA 52403 and is currently estimated at $305,101, approximately $160 per square foot. 2377 Blake Blvd SE is a home located in Linn County with nearby schools including Grant Wood Elementary School, McKinley STEAM Academy, and George Washington High School.
Ownership History
Date
Name
Owned For
Owner Type
Purchase Details
Closed on
Jan 8, 2010
Sold by
Livengood Curtis D
Bought by
Livengood Beth C
Current Estimated Value
Purchase Details
Closed on
Jan 9, 2004
Sold by
Babaloyne Christine S and Urquhart Benjamin H
Bought by
Bucknell Shannon A and Bucknell Heather L
Home Financials for this Owner
Home Financials are based on the most recent Mortgage that was taken out on this home.
Original Mortgage
$179,955
Interest Rate
5.74%
Mortgage Type
Unknown
Purchase Details
Closed on
May 25, 2000
Sold by
Weger John T and Fiege Ruth C
Bought by
Urquhart Benjamin H and Babaloyne Christine S
Home Financials for this Owner
Home Financials are based on the most recent Mortgage that was taken out on this home.
Original Mortgage
$156,400
Interest Rate
8.18%
Purchase Details
Closed on
Jul 27, 1999
Sold by
Cooley Healy Faye and Healy Michael D
Bought by
Weger John T and Fiege Ruth C
Home Financials for this Owner
Home Financials are based on the most recent Mortgage that was taken out on this home.
Original Mortgage
$175,750
Interest Rate
7.5%
Create a Home Valuation Report for This Property
The Home Valuation Report is an in-depth analysis detailing your home's value as well as a comparison with similar homes in the area
Home Values in the Area
Average Home Value in this Area
Purchase History
| Date | Buyer | Sale Price | Title Company |
|---|---|---|---|
| Livengood Beth C | -- | None Available | |
| Bucknell Shannon A | $199,500 | -- | |
| Urquhart Benjamin H | $195,000 | -- | |
| Weger John T | $184,812 | -- |
Source: Public Records
Mortgage History
| Date | Status | Borrower | Loan Amount |
|---|---|---|---|
| Previous Owner | Bucknell Shannon A | $179,955 | |
| Previous Owner | Urquhart Benjamin H | $156,400 | |
| Previous Owner | Weger John T | $175,750 |
Source: Public Records
Tax History
| Year | Tax Paid | Tax Assessment Tax Assessment Total Assessment is a certain percentage of the fair market value that is determined by local assessors to be the total taxable value of land and additions on the property. | Land | Improvement |
|---|---|---|---|---|
| 2025 | $5,294 | $323,000 | $51,300 | $271,700 |
| 2024 | $5,304 | $299,200 | $45,200 | $254,000 |
| 2023 | $5,304 | $299,200 | $45,200 | $254,000 |
| 2022 | $5,002 | $251,500 | $42,200 | $209,300 |
| 2021 | $5,348 | $241,500 | $42,200 | $199,300 |
| 2020 | $5,348 | $242,400 | $42,200 | $200,200 |
| 2019 | $4,924 | $228,400 | $30,200 | $198,200 |
Source: Public Records
Map
Nearby Homes
- 2335 Blake Blvd SE
- 2432 4th Ave SE
- 2159 Linden Dr SE
- 2300 4th Ave SE
- 198 Forest Dr SE
- 202 Forest Dr SE
- 2253 Meadowbrook Dr SE
- 330 Crescent St SE
- 2101 Washington Ave SE
- 2039 Park Ave SE
- 2323 Upland Dr SE
- 182 Ryecroft SE
- 2226 5th Ave SE
- 385 21st St SE
- 2026 Bever Ave SE
- 2927 Mansfield Ave SE
- 2005 Washington Ave SE
- 420 30th St SE
- 500 31st St SE
- 2055 Cottage Glen Rd SE
- 2385 Blake Blvd SE
- 2375 Blake Blvd SE
- 2395 Blake Blvd SE
- 2355 Blake Blvd SE
- 2397 Blake Blvd SE
- 2444 Grande Ave SE
- 2432 Grande Ave SE
- 2426 Grande Ave SE
- 2388 Blake Blvd SE
- 2418 Grande Ave SE
- 2390 Blake Blvd SE
- 2399 Blake Blvd SE
- 2392 Blake Blvd SE
- 2410 Grande Ave SE
- 2404 Grande Ave SE
- 2345 Blake Blvd SE
- 11 Blake Ct SE
- 2396 Blake Blvd SE
- 2338 Blake Blvd SE
- 2342 Grande Ave SE
Your Personal Tour Guide
Ask me questions while you tour the home.