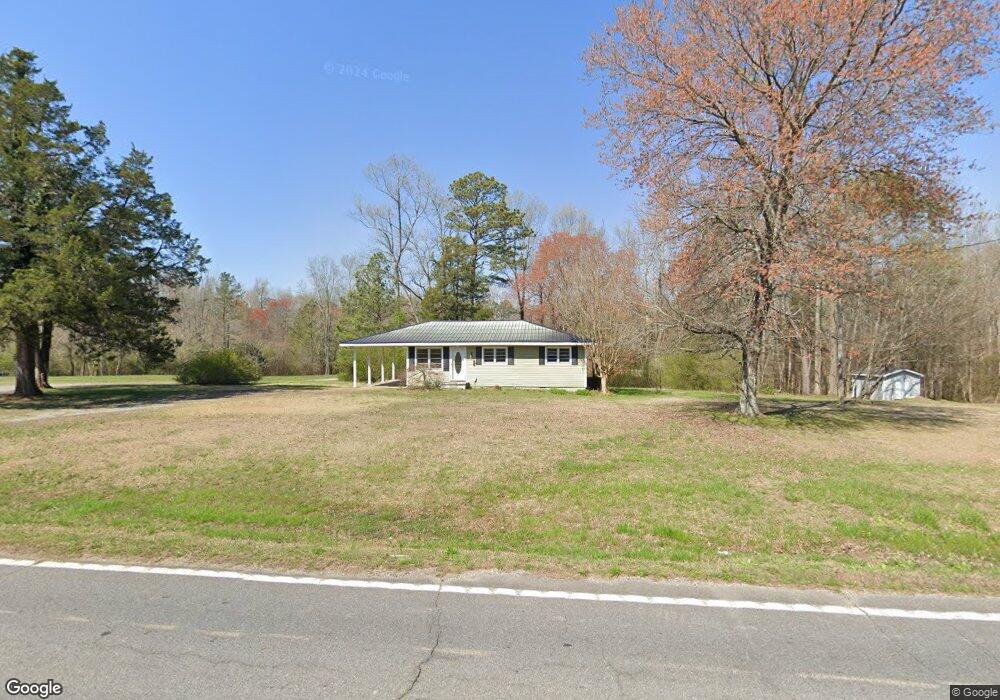
2378 Highway 95 Rock Spring, GA 30739
Rock Spring NeighborhoodEstimated Value: $146,317 - $204,000
Studio
1
Bath
999
Sq Ft
$176/Sq Ft
Est. Value
About This Home
This home is located at 2378 Highway 95, Rock Spring, GA 30739 and is currently estimated at $175,329, approximately $175 per square foot. 2378 Highway 95 is a home located in Walker County with nearby schools including Rock Spring Elementary School, Lafayette High School, and Alice M Daley Adventist School.
Ownership History
Date
Name
Owned For
Owner Type
Purchase Details
Closed on
Nov 6, 1997
Sold by
Williams Randall Lynn and Williams Marla
Bought by
Carlton James W and Carlton Tyra G
Current Estimated Value
Purchase Details
Closed on
Jan 22, 1994
Sold by
Ellis Lynn
Bought by
Williams Randall Lynn and Williams Marla
Purchase Details
Closed on
Jul 20, 1984
Sold by
Lynn Benny L and Lynn Scoggins
Bought by
Ellis Lynn
Purchase Details
Closed on
Feb 14, 1980
Sold by
Jester Ross J and Jester Gladys R
Bought by
Lynn Benny L and Lynn Scoggins
Purchase Details
Closed on
Aug 14, 1979
Sold by
Bowman Juanita Stephenson and Bowman E
Bought by
Jester Ross J and Jester Gladys R
Purchase Details
Closed on
Jun 20, 1979
Sold by
Stephenson J E
Bought by
Bowman Juanita Stephenson and Bowman E
Purchase Details
Closed on
Jan 1, 1972
Bought by
Stephenson J E
Create a Home Valuation Report for This Property
The Home Valuation Report is an in-depth analysis detailing your home's value as well as a comparison with similar homes in the area
Home Values in the Area
Average Home Value in this Area
Purchase History
| Date | Buyer | Sale Price | Title Company |
|---|---|---|---|
| Carlton James W | $27,000 | -- | |
| Williams Randall Lynn | $30,000 | -- | |
| Ellis Lynn | -- | -- | |
| Lynn Benny L | $22,000 | -- | |
| Jester Ross J | $20,000 | -- | |
| Bowman Juanita Stephenson | -- | -- | |
| Stephenson J E | -- | -- |
Source: Public Records
Tax History
| Year | Tax Paid | Tax Assessment Tax Assessment Total Assessment is a certain percentage of the fair market value that is determined by local assessors to be the total taxable value of land and additions on the property. | Land | Improvement |
|---|---|---|---|---|
| 2024 | $1,290 | $56,599 | $6,959 | $49,640 |
| 2023 | $1,230 | $52,593 | $5,523 | $47,070 |
| 2022 | $1,126 | $44,163 | $4,071 | $40,092 |
| 2021 | $848 | $29,095 | $4,071 | $25,024 |
| 2020 | $721 | $23,252 | $4,071 | $19,181 |
| 2019 | $732 | $23,252 | $4,071 | $19,181 |
| 2018 | $615 | $23,252 | $4,071 | $19,181 |
| 2017 | $795 | $23,252 | $4,071 | $19,181 |
| 2016 | $699 | $23,252 | $4,071 | $19,181 |
| 2015 | $656 | $20,180 | $6,336 | $13,844 |
| 2014 | $574 | $20,180 | $6,336 | $13,844 |
| 2013 | -- | $20,180 | $6,336 | $13,844 |
Source: Public Records
Map
Nearby Homes
- 94 Ringgold Rd
- 40 Blessed Way
- 0 Tarvin Rd Unit 1523862
- 146 Hinton Ln
- 287 E Teems Rd
- 00 Georgia 95
- 10180 Us Highway 27
- 0 Bicentennial Trail Unit 7707994
- 0 Bicentennial Trail Unit 7707991
- 0 Bicentennial Trail Unit 10680206
- 0 Bicentennial Trail Unit 10687168
- 0 Bicentennial Trail Unit 10687173
- 0 Bicentennial Trail Unit 7707992
- 0 Bicentennial Trail Unit 10687176
- 0 Bicentennial Trail Unit 7707995
- 200 Ash Ln
- 524 E Teems Rd
- 0 Clyde Byrd Rd
- 1003 Highway N Old 27
- 1308 Spring Meadows Dr
- 2344 Georgia 95
- 2344 Highway 95
- 2373 Highway 95
- 2432 Highway 95
- 2418 Highway 95
- 2421 Highway 95
- 2308 Highway 95
- 2305 Highway 95
- 2164 Highway 95
- 2468 Highway 95
- 2262 Highway 95
- 2262 Georgia 95
- 2259 Highway 95
- 2515 Highway 95
- 135 Hankins Rd
- 2416 Highway 95
- 87 Hankins Rd
- 2195 Highway 95
- 129 Wood Station Rd
- 2175 Highway 95
Your Personal Tour Guide
Ask me questions while you tour the home.