23783 Boat House Rd Saint Michaels, MD 21663
Estimated Value: $4,223,429 - $5,022,000
--
Bed
4
Baths
7,294
Sq Ft
$633/Sq Ft
Est. Value
About This Home
This home is located at 23783 Boat House Rd, Saint Michaels, MD 21663 and is currently estimated at $4,614,143, approximately $632 per square foot. 23783 Boat House Rd is a home located in Talbot County with nearby schools including St. Michaels Elementary School, St. Michaels Middle/High School, and Easton High School.
Ownership History
Date
Name
Owned For
Owner Type
Purchase Details
Closed on
Jan 5, 2021
Sold by
Kreindler Peter M and Kreindler Alice
Bought by
23783 Emerson Point Road Llc
Current Estimated Value
Purchase Details
Closed on
Feb 7, 2011
Sold by
Kreindler Peter M
Bought by
Kreindler Peter M and Kreindler Alice
Purchase Details
Closed on
Jan 20, 2011
Sold by
Kreindler Peter M
Bought by
Kreindler Peter M and Kreindler Alice
Purchase Details
Closed on
Jan 6, 2011
Sold by
Kreindler Alice
Bought by
Kreindler Alice and Kreindler Peter M
Purchase Details
Closed on
Oct 2, 2003
Sold by
Miller John H and Miller Emily T
Bought by
Kreindler Peter M and Kreindler Alice
Purchase Details
Closed on
Dec 28, 2000
Sold by
Stevens Lucy Et Vir
Bought by
Miller John H and Miller Emily T
Create a Home Valuation Report for This Property
The Home Valuation Report is an in-depth analysis detailing your home's value as well as a comparison with similar homes in the area
Home Values in the Area
Average Home Value in this Area
Purchase History
| Date | Buyer | Sale Price | Title Company |
|---|---|---|---|
| 23783 Emerson Point Road Llc | -- | Eastern Shore Title Company | |
| Kreindler Peter M | -- | Eastern Shore Title Company | |
| Kreindler Peter M | -- | -- | |
| Kreindler Peter M | -- | -- | |
| Kreindler Alice | -- | Talbot Title Company | |
| Kreindler Peter M | -- | Talbot Title Company | |
| Kreindler Peter M | -- | Talbot Title Company Inc | |
| Kreindler Peter M | $2,100,000 | -- | |
| Miller John H | $502,000 | -- |
Source: Public Records
Tax History Compared to Growth
Tax History
| Year | Tax Paid | Tax Assessment Tax Assessment Total Assessment is a certain percentage of the fair market value that is determined by local assessors to be the total taxable value of land and additions on the property. | Land | Improvement |
|---|---|---|---|---|
| 2025 | $25,788 | $3,067,800 | $1,249,700 | $1,818,100 |
| 2024 | $25,788 | $2,874,367 | $0 | $0 |
| 2023 | $22,793 | $2,680,933 | $0 | $0 |
| 2022 | $19,641 | $2,487,500 | $1,187,200 | $1,300,300 |
| 2021 | $37,384 | $2,437,467 | $0 | $0 |
| 2020 | $17,947 | $2,387,433 | $0 | $0 |
| 2019 | $17,423 | $2,337,400 | $1,087,300 | $1,250,100 |
| 2018 | $16,703 | $2,337,400 | $1,087,300 | $1,250,100 |
| 2017 | $15,916 | $2,337,400 | $0 | $0 |
| 2016 | $15,520 | $2,405,700 | $0 | $0 |
| 2015 | $13,875 | $2,405,700 | $0 | $0 |
| 2014 | $13,875 | $2,405,700 | $0 | $0 |
Source: Public Records
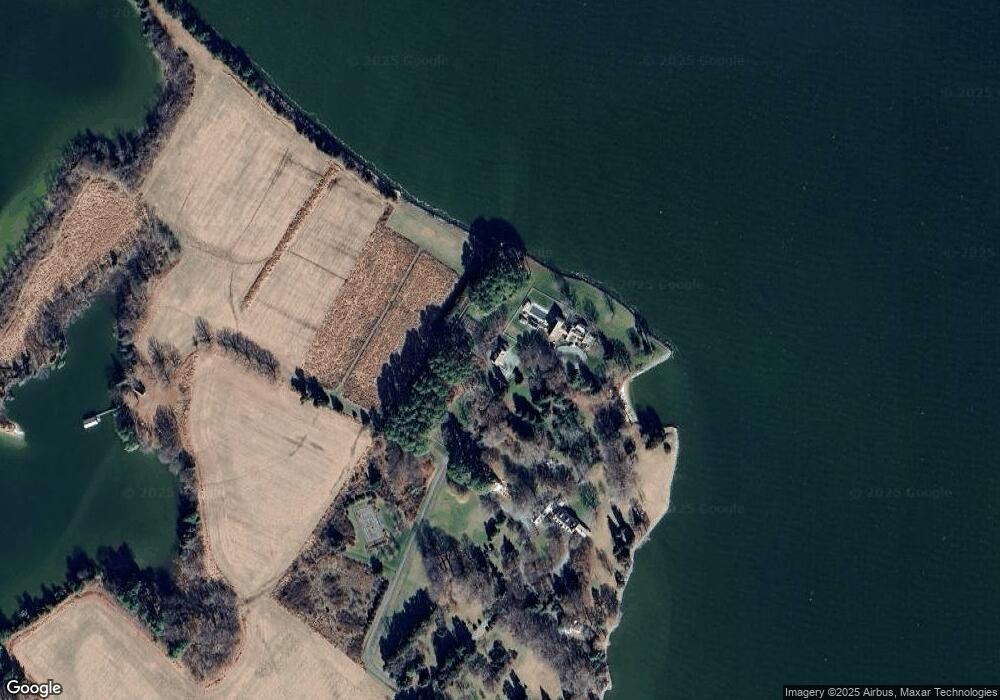
Map
Nearby Homes
- 9791 Pintail Place
- 9560 Martingham Cir
- 10770 Rich Neck Rd
- 9539 Quail Hollow Dr Unit 303
- 9681 Macks Ln
- 24362 Widgeon Place Unit 4
- 24420 Mallard Place
- 24560 Deepwater Point Dr Unit 1
- 9235 Martingham Dr
- 9262 Macks Ln
- 0 Bozman Neavitt Rd Unit MDTA2011976
- 9171 Deepwater Point Rd
- 24749 Swan Rd
- 00 New Rd
- 9998 Wades Farm Ln
- 8620 Bozman Neavitt Rd
- 216 Brooks Ln
- 300 Perry St
- 408 Spinnaker Ln
- 207 Dodson Ave
- 10064 Boat House Cove
- 10066 Boat House Cove
- 10062 Emerson Point Rd
- 23765 Boat House Rd
- 23747 Boat House Rd
- 10012 Emerson Point Rd
- 9990 Emerson Point Rd
- 10341 Sherwood Manor Dr
- 10241 Sherwood Manor Dr
- 23722 Saint Michaels Rd
- 9969 Claiborne Rd
- 10295 Sherwood Manor Dr
- 10373 Sherwood Manor Dr
- 10443 Sherwood Manor Dr
- 10185 Sherwood Manor Dr
- 0 Emerson Point Unit 1004657874
- 9864 N Claiborne Rd
- 9876 N Claiborne Rd
- 9896 N Claiborne Rd
- 23581 Saint Michaels Rd