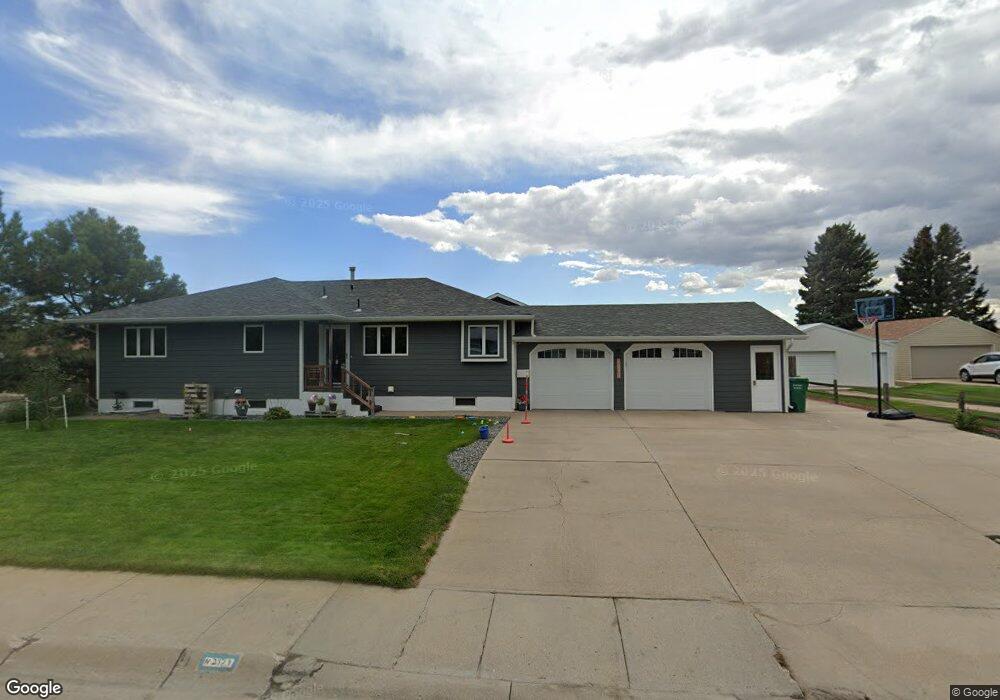
2379 Newton St Sidney, NE 69162
Estimated Value: $267,000 - $296,772
2
Beds
2
Baths
2,069
Sq Ft
$134/Sq Ft
Est. Value
About This Home
This home is located at 2379 Newton St, Sidney, NE 69162 and is currently estimated at $277,924, approximately $134 per square foot. 2379 Newton St is a home located in Cheyenne County with nearby schools including Central Elementary School, South Ward Elementary School, and North Ward Elementary School.
Ownership History
Date
Name
Owned For
Owner Type
Purchase Details
Closed on
Jun 26, 2018
Sold by
Jenkins Robin R
Bought by
Long Kyle and Long Meagan
Current Estimated Value
Purchase Details
Closed on
Nov 29, 2006
Sold by
Jenkins Ken L and Jenkins Robin R
Bought by
Gusman Ryan D and Hicks- Gusman Taryn K
Home Financials for this Owner
Home Financials are based on the most recent Mortgage that was taken out on this home.
Original Mortgage
$170,000
Interest Rate
6.3%
Create a Home Valuation Report for This Property
The Home Valuation Report is an in-depth analysis detailing your home's value as well as a comparison with similar homes in the area
Home Values in the Area
Average Home Value in this Area
Purchase History
| Date | Buyer | Sale Price | Title Company |
|---|---|---|---|
| Long Kyle | $209,000 | -- | |
| Gusman Ryan D | -- | -- |
Source: Public Records
Mortgage History
| Date | Status | Borrower | Loan Amount |
|---|---|---|---|
| Previous Owner | Gusman Ryan D | $170,000 |
Source: Public Records
Tax History Compared to Growth
Tax History
| Year | Tax Paid | Tax Assessment Tax Assessment Total Assessment is a certain percentage of the fair market value that is determined by local assessors to be the total taxable value of land and additions on the property. | Land | Improvement |
|---|---|---|---|---|
| 2024 | $4,067 | $220,939 | $20,199 | $200,740 |
| 2023 | $5,084 | $224,822 | $20,199 | $204,623 |
| 2022 | $4,741 | $204,544 | $20,199 | $184,345 |
| 2021 | $4,484 | $191,784 | $20,199 | $171,585 |
| 2020 | $4,039 | $173,006 | $17,571 | $155,435 |
| 2019 | $3,842 | $165,789 | $17,571 | $148,218 |
| 2018 | $4,372 | $192,762 | $20,416 | $172,346 |
| 2017 | $5,013 | $224,142 | $23,740 | $200,402 |
| 2016 | $4,795 | $224,142 | $23,740 | $200,402 |
| 2015 | $4,850 | $224,142 | $23,740 | $200,402 |
| 2014 | $4,950 | $220,772 | $23,740 | $197,032 |
Source: Public Records
Map
Nearby Homes