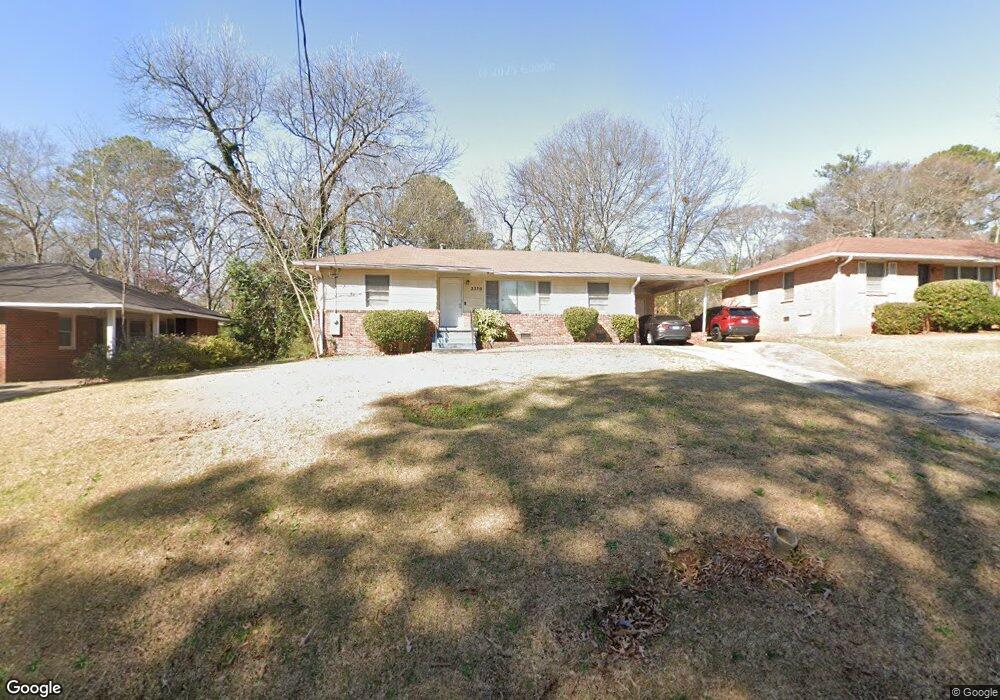
2379 Perkerson Rd SW Atlanta, GA 30315
Perkerson NeighborhoodEstimated Value: $225,519 - $231,000
3
Beds
2
Baths
1,270
Sq Ft
$180/Sq Ft
Est. Value
About This Home
This home is located at 2379 Perkerson Rd SW, Atlanta, GA 30315 and is currently estimated at $229,130, approximately $180 per square foot. 2379 Perkerson Rd SW is a home located in Fulton County with nearby schools including Hutchinson Elementary School, Long Middle School, and South Atlanta High School.
Ownership History
Date
Name
Owned For
Owner Type
Purchase Details
Closed on
Jun 9, 2021
Sold by
Rntr 3 Llc
Bought by
Fkh Sfr Propco D Lp
Current Estimated Value
Purchase Details
Closed on
Aug 22, 2013
Sold by
Robinson Doris
Bought by
Rntr 3 Llc
Purchase Details
Closed on
Jul 29, 2011
Sold by
Sheets Brandon
Bought by
Robinson Doris
Purchase Details
Closed on
Jul 16, 2010
Sold by
Hud & Housing Of Urban Dev
Bought by
Sheets Brandon
Purchase Details
Closed on
May 5, 2009
Sold by
Lenders Other Instl
Bought by
Hud & Housing Of Urban Dev
Purchase Details
Closed on
Mar 31, 1997
Sold by
Sec Hud
Bought by
Higgins Lorenzo
Home Financials for this Owner
Home Financials are based on the most recent Mortgage that was taken out on this home.
Original Mortgage
$57,525
Interest Rate
7.85%
Mortgage Type
FHA
Purchase Details
Closed on
Nov 4, 1996
Sold by
Mitchell Roosevelt
Bought by
Nationsbanc Mtg Corp Ny
Purchase Details
Closed on
Oct 22, 1996
Sold by
Nationsbanc Mtg Corp Ny
Bought by
Secretary Of Hud
Create a Home Valuation Report for This Property
The Home Valuation Report is an in-depth analysis detailing your home's value as well as a comparison with similar homes in the area
Home Values in the Area
Average Home Value in this Area
Purchase History
| Date | Buyer | Sale Price | Title Company |
|---|---|---|---|
| Fkh Sfr Propco D Lp | $19,113,164 | -- | |
| Rntr 3 Llc | $57,500 | -- | |
| Robinson Doris | $25,000 | -- | |
| Sheets Brandon | -- | -- | |
| Hud & Housing Of Urban Dev | -- | -- | |
| Lenders Other Instl | $70,063 | -- | |
| Higgins Lorenzo | -- | -- | |
| Nationsbanc Mtg Corp Ny | $69,000 | -- | |
| Secretary Of Hud | -- | -- |
Source: Public Records
Mortgage History
| Date | Status | Borrower | Loan Amount |
|---|---|---|---|
| Previous Owner | Higgins Lorenzo | $57,525 |
Source: Public Records
Tax History Compared to Growth
Tax History
| Year | Tax Paid | Tax Assessment Tax Assessment Total Assessment is a certain percentage of the fair market value that is determined by local assessors to be the total taxable value of land and additions on the property. | Land | Improvement |
|---|---|---|---|---|
| 2025 | $3,177 | $99,600 | $18,560 | $81,040 |
| 2023 | $4,302 | $99,600 | $18,560 | $81,040 |
| 2022 | $1,991 | $49,200 | $6,520 | $42,680 |
| 2021 | $1,993 | $49,200 | $6,520 | $42,680 |
| 2020 | $1,549 | $49,200 | $6,520 | $42,680 |
| 2019 | $491 | $37,800 | $3,400 | $34,400 |
| 2018 | $816 | $19,720 | $3,520 | $16,200 |
| 2017 | $561 | $13,000 | $2,280 | $10,720 |
| 2016 | $563 | $13,000 | $2,280 | $10,720 |
| 2015 | $1,057 | $13,000 | $2,280 | $10,720 |
| 2014 | $589 | $13,000 | $2,280 | $10,720 |
Source: Public Records
Map
Nearby Homes
- 733 Pegg Rd SW
- 754 Pegg Rd SW
- 2369 Springdale Rd SW
- 2304 Springdale Cir SW
- 2494 Baxter Rd SW
- 793 Springdale Place SW
- 2493 Springdale Rd SW
- 2425 Hanford Dr SW
- 732 Quaker St SW
- 752 Jefferson Ave SW
- 2228 Springdale Cir SW
- 804 Brookdale Dr SW
- 2233 Springdale Cir SW
- 2431 Sylvan Rd
- 633 Langston Dr SW
- 489 Pomona Cir SW
- 2138 Springdale Rd SW
- 2499 Sylvan Rd
- 451 Pomona Cir SW
- 488 Pomona Cir SW
- 2379 Perkerson Rd SW Unit 2379
- 2379 Perkerson Rd SW
- 2379 Perkerson Rd SW
- 2385 Perkerson Rd SW Unit 2385
- 2371 Perkerson Rd SW
- 710 Vinson Place SW Unit 3
- 2395 Perkerson Rd SW
- 711 Pegg Rd SW
- 716 Vinson Place SW
- 717 Pegg Rd SW
- 2359 Perkerson Rd SW
- 2376 Perkerson Rd SW
- 2370 Perkerson Rd SW
- 724 Vinson Place SW
- 725 Pegg Rd SW
- 2360 Perkerson Rd SW
- 2394 Perkerson Rd SW
- 2407 Perkerson Rd SW
- 732 Vinson Place SW
- 708 Pegg Rd SW