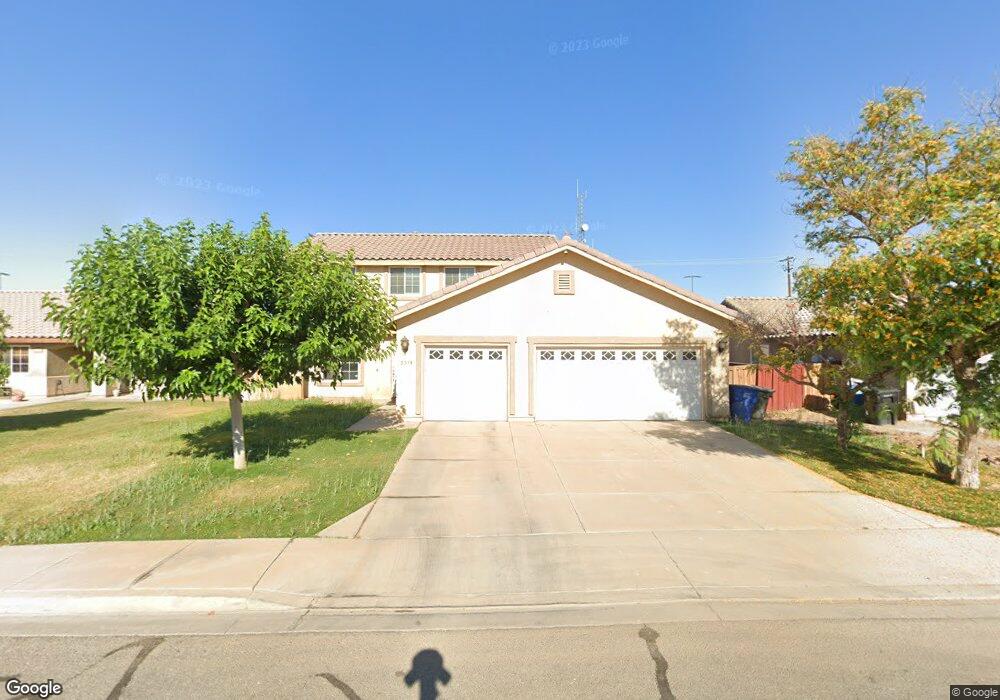
2379 Tori Ct Imperial, CA 92251
Estimated Value: $428,000 - $463,000
5
Beds
3
Baths
1,918
Sq Ft
$233/Sq Ft
Est. Value
About This Home
This home is located at 2379 Tori Ct, Imperial, CA 92251 and is currently estimated at $446,913, approximately $233 per square foot. 2379 Tori Ct is a home located in Imperial County with nearby schools including Meadows Elementary School, Central Union High School, and Valley Christian School.
Ownership History
Date
Name
Owned For
Owner Type
Purchase Details
Closed on
Sep 17, 2010
Sold by
Federal Home Loan Mortgage Corporation
Bought by
Ortiz Samuel D and Ortiz Janette
Current Estimated Value
Home Financials for this Owner
Home Financials are based on the most recent Mortgage that was taken out on this home.
Original Mortgage
$150,000
Outstanding Balance
$98,242
Interest Rate
4.28%
Mortgage Type
VA
Estimated Equity
$348,671
Purchase Details
Closed on
Jul 1, 2010
Sold by
Cordova Lionel
Bought by
Federal Home Loan Mortgage Corporation
Purchase Details
Closed on
May 16, 2005
Sold by
Victoria Place Llc
Bought by
Cordova Lionel
Home Financials for this Owner
Home Financials are based on the most recent Mortgage that was taken out on this home.
Original Mortgage
$225,120
Interest Rate
5.93%
Mortgage Type
Fannie Mae Freddie Mac
Create a Home Valuation Report for This Property
The Home Valuation Report is an in-depth analysis detailing your home's value as well as a comparison with similar homes in the area
Home Values in the Area
Average Home Value in this Area
Purchase History
| Date | Buyer | Sale Price | Title Company |
|---|---|---|---|
| Ortiz Samuel D | $150,000 | Chicago Title Company | |
| Federal Home Loan Mortgage Corporation | $149,900 | Servicelink | |
| Cordova Lionel | $281,500 | Stewart Title Company |
Source: Public Records
Mortgage History
| Date | Status | Borrower | Loan Amount |
|---|---|---|---|
| Open | Ortiz Samuel D | $150,000 | |
| Previous Owner | Cordova Lionel | $225,120 |
Source: Public Records
Tax History Compared to Growth
Tax History
| Year | Tax Paid | Tax Assessment Tax Assessment Total Assessment is a certain percentage of the fair market value that is determined by local assessors to be the total taxable value of land and additions on the property. | Land | Improvement |
|---|---|---|---|---|
| 2025 | $4,462 | $192,162 | $44,833 | $147,329 |
| 2023 | $4,462 | $184,702 | $43,093 | $141,609 |
| 2022 | $4,340 | $181,082 | $42,249 | $138,833 |
| 2021 | $4,278 | $177,532 | $41,421 | $136,111 |
| 2020 | $4,313 | $175,713 | $40,997 | $134,716 |
| 2019 | $4,247 | $172,269 | $40,194 | $132,075 |
| 2018 | $4,179 | $168,892 | $39,406 | $129,486 |
| 2017 | $4,153 | $165,582 | $38,634 | $126,948 |
| 2016 | $4,079 | $162,336 | $37,877 | $124,459 |
| 2015 | $4,085 | $159,899 | $37,309 | $122,590 |
| 2014 | $4,093 | $156,768 | $36,579 | $120,189 |
Source: Public Records
Map
Nearby Homes
- 184 Jacob St
- 2402 Barbara St
- 2386 Dale Ct
- 190 W Bernardi St
- 2341 Marlene Ave
- 2376 Park Ct
- 0 Cabo San Lucas Ave
- 2302 Baily Ray Ave
- 2320 Alejandro Ave
- 2319 Alex Ave
- 329 W Aten Rd
- 2315 Paige Ave
- 2316 Paige Ave
- 2314 Paige Ave
- 385 W Aten Rd
- 2201 Cross Rd
- 1751 N McDonald St Unit 1753
- 1751 N 8th St
- 1751 N McDonald 1753 St
- 900 Fieldbrook Ct