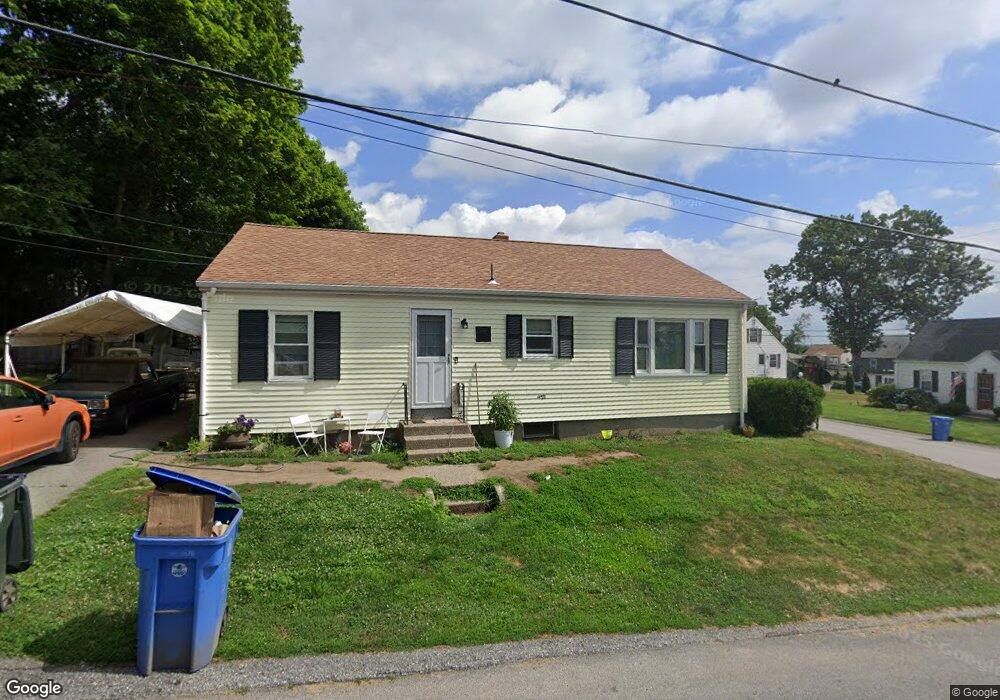
238 Ann St Cumberland, RI 02864
Valley Falls NeighborhoodEstimated Value: $366,664 - $420,000
3
Beds
1
Bath
1,040
Sq Ft
$382/Sq Ft
Est. Value
About This Home
This home is located at 238 Ann St, Cumberland, RI 02864 and is currently estimated at $397,166, approximately $381 per square foot. 238 Ann St is a home located in Providence County with nearby schools including B.F. Norton Elementary School, Joseph L. McCourt Middle School, and Cumberland High School.
Ownership History
Date
Name
Owned For
Owner Type
Purchase Details
Closed on
Sep 18, 2017
Sold by
Ohara Wilfred Est
Bought by
Perry Dana A and Perry Donna M
Current Estimated Value
Home Financials for this Owner
Home Financials are based on the most recent Mortgage that was taken out on this home.
Original Mortgage
$112,000
Outstanding Balance
$92,704
Interest Rate
3.93%
Mortgage Type
New Conventional
Estimated Equity
$304,462
Purchase Details
Closed on
Jun 22, 1976
Bought by
Ohara Wilfred
Create a Home Valuation Report for This Property
The Home Valuation Report is an in-depth analysis detailing your home's value as well as a comparison with similar homes in the area
Home Values in the Area
Average Home Value in this Area
Purchase History
| Date | Buyer | Sale Price | Title Company |
|---|---|---|---|
| Perry Dana A | $140,000 | -- | |
| Ohara Wilfred | -- | -- |
Source: Public Records
Mortgage History
| Date | Status | Borrower | Loan Amount |
|---|---|---|---|
| Open | Ohara Wilfred | $112,000 | |
| Previous Owner | Ohara Wilfred | $93,000 | |
| Previous Owner | Ohara Wilfred | $88,429 | |
| Previous Owner | Ohara Wilfred | $150,000 |
Source: Public Records
Tax History
| Year | Tax Paid | Tax Assessment Tax Assessment Total Assessment is a certain percentage of the fair market value that is determined by local assessors to be the total taxable value of land and additions on the property. | Land | Improvement |
|---|---|---|---|---|
| 2025 | $3,286 | $267,800 | $125,400 | $142,400 |
| 2024 | $3,200 | $267,800 | $125,400 | $142,400 |
| 2023 | $3,112 | $267,800 | $125,400 | $142,400 |
| 2022 | $2,956 | $197,200 | $87,700 | $109,500 |
| 2021 | $2,907 | $197,200 | $87,700 | $109,500 |
| 2020 | $2,824 | $197,200 | $87,700 | $109,500 |
| 2019 | $2,642 | $166,400 | $73,300 | $93,100 |
| 2018 | $2,566 | $166,400 | $73,300 | $93,100 |
| 2017 | $2,531 | $166,400 | $73,300 | $93,100 |
| 2016 | $2,255 | $132,000 | $64,700 | $67,300 |
| 2015 | $2,255 | $132,000 | $64,700 | $67,300 |
| 2014 | $4,381 | $132,000 | $64,700 | $67,300 |
| 2013 | $2,331 | $147,700 | $65,700 | $82,000 |
Source: Public Records
Map
Nearby Homes
Your Personal Tour Guide
Ask me questions while you tour the home.