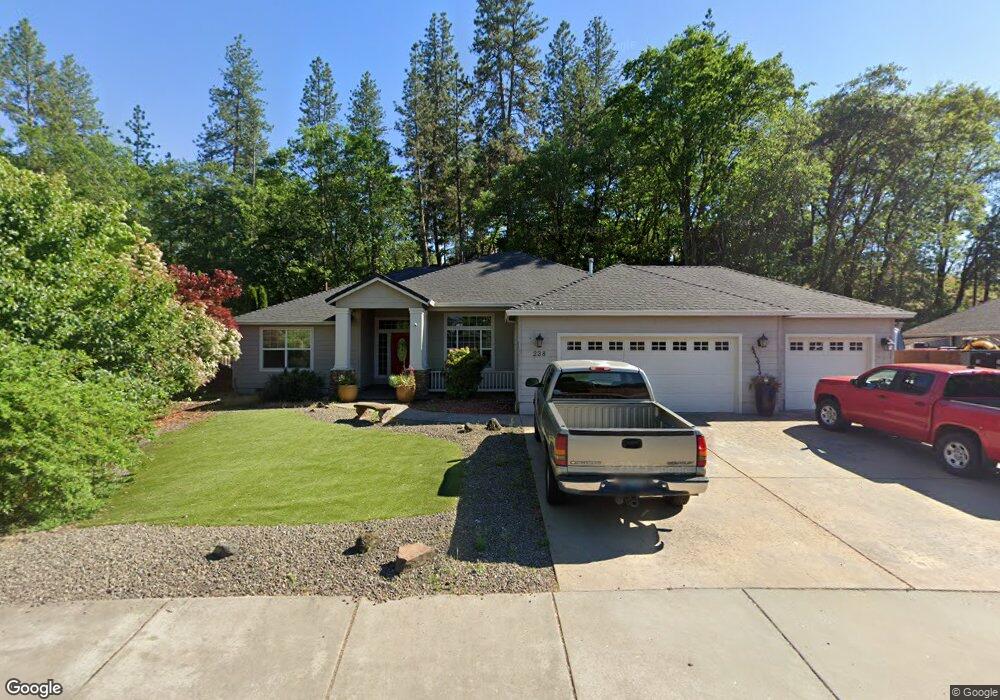
238 Arrowhead Trail Eagle Point, OR 97524
Estimated Value: $499,000 - $548,000
3
Beds
2
Baths
2,010
Sq Ft
$258/Sq Ft
Est. Value
About This Home
This home is located at 238 Arrowhead Trail, Eagle Point, OR 97524 and is currently estimated at $517,941, approximately $257 per square foot. 238 Arrowhead Trail is a home located in Jackson County with nearby schools including Eagle Point Middle School, White Mountain Middle School, and Eagle Point High School.
Ownership History
Date
Name
Owned For
Owner Type
Purchase Details
Closed on
Jun 1, 2007
Sold by
Vander Horst W Scott
Bought by
Vander Horst W H M J
Current Estimated Value
Home Financials for this Owner
Home Financials are based on the most recent Mortgage that was taken out on this home.
Original Mortgage
$290,000
Outstanding Balance
$169,707
Interest Rate
5.75%
Mortgage Type
Unknown
Estimated Equity
$348,234
Purchase Details
Closed on
Feb 26, 2007
Sold by
Vander Horst W H M J
Bought by
Scott Vander Horst W H M J and Scott Van Der Horst W
Purchase Details
Closed on
Mar 31, 2005
Sold by
Bob Fellows Construction Llc
Bought by
H M J Van Der Horst W
Home Financials for this Owner
Home Financials are based on the most recent Mortgage that was taken out on this home.
Original Mortgage
$284,000
Interest Rate
1.5%
Mortgage Type
Negative Amortization
Create a Home Valuation Report for This Property
The Home Valuation Report is an in-depth analysis detailing your home's value as well as a comparison with similar homes in the area
Home Values in the Area
Average Home Value in this Area
Purchase History
| Date | Buyer | Sale Price | Title Company |
|---|---|---|---|
| Vander Horst W H M J | -- | None Available | |
| Scott Vander Horst W H M J | -- | None Available | |
| H M J Van Der Horst W | $363,850 | Amerititle |
Source: Public Records
Mortgage History
| Date | Status | Borrower | Loan Amount |
|---|---|---|---|
| Open | Vander Horst W H M J | $290,000 | |
| Previous Owner | H M J Van Der Horst W | $284,000 |
Source: Public Records
Tax History
| Year | Tax Paid | Tax Assessment Tax Assessment Total Assessment is a certain percentage of the fair market value that is determined by local assessors to be the total taxable value of land and additions on the property. | Land | Improvement |
|---|---|---|---|---|
| 2026 | $3,422 | $284,030 | -- | -- |
| 2025 | $3,341 | $275,760 | $86,990 | $188,770 |
| 2024 | $3,341 | $267,730 | $84,460 | $183,270 |
| 2023 | $3,228 | $259,940 | $82,010 | $177,930 |
| 2022 | $3,140 | $259,940 | $82,010 | $177,930 |
| 2021 | $3,047 | $252,370 | $79,620 | $172,750 |
| 2020 | $3,237 | $245,020 | $77,300 | $167,720 |
| 2019 | $3,188 | $230,970 | $72,860 | $158,110 |
| 2018 | $3,127 | $224,250 | $70,730 | $153,520 |
| 2017 | $3,050 | $224,250 | $70,730 | $153,520 |
| 2016 | $2,991 | $211,380 | $66,670 | $144,710 |
| 2015 | $2,893 | $211,380 | $66,670 | $144,710 |
| 2014 | $2,810 | $199,260 | $62,840 | $136,420 |
Source: Public Records
Map
Nearby Homes
- 1065 S Shasta Ave
- 1288 S Shasta Ave
- 1314 S Shasta Ave Unit A
- 91 Morning Dove Trail
- 10569 Hannon Rd
- 181 Morning Dove Trail
- 51 Broken Stone Way
- 179 Skyhawk Dr
- 133 Edith Cir
- 0 Sf Little Butte Unit 220204792
- 616 Cedarwood Dr
- 0 Crater Lake Hwy
- 620 S Royal Ave
- 650 Sarah Ln
- 16 Portabello Way
- 888 Arrowhead Trail
- 839 St Andrews Way
- 13 Portabello Way
- 522 Meadow Ln
- 318 S Buchanan Ave
- 232 Arrowhead Trail
- 260 Arrowhead Trail
- 983 Black Wolf Ln
- 286 Arrowhead Trail
- 977 Black Wolf Ln
- 245 Arrowhead Trail
- 302 Arrowhead Trail
- 1024 S Shasta Ave
- 1006 S Shasta Ave
- 1006 S Shasta Ave Unit 1006/1008
- 971 Black Wolf Ln
- 966 Black Wolf Ln
- 301 Arrowhead Trail
- 1042 S Shasta Ave
- 446 Arrowhead Trail
- 434 Arrowhead Trail
- 996 S Shasta Ave Unit 996
- 1131 S Shasta Ave
- 308 Arrowhead Trail
- 965 Black Wolf Ln
Your Personal Tour Guide
Ask me questions while you tour the home.