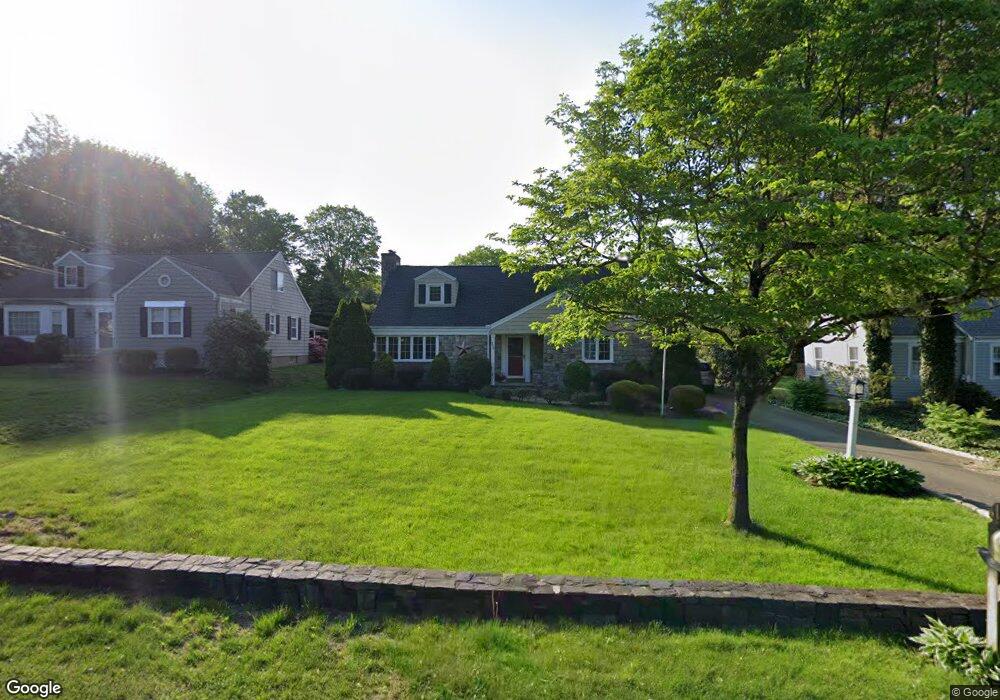
238 Edison Rd Trumbull, CT 06611
West Trumbull NeighborhoodEstimated Value: $641,592 - $728,000
4
Beds
3
Baths
2,070
Sq Ft
$327/Sq Ft
Est. Value
About This Home
This home is located at 238 Edison Rd, Trumbull, CT 06611 and is currently estimated at $676,398, approximately $326 per square foot. 238 Edison Rd is a home located in Fairfield County with nearby schools including Frenchtown Elementary School, Madison Middle School, and Trumbull High School.
Ownership History
Date
Name
Owned For
Owner Type
Purchase Details
Closed on
Jun 7, 2010
Sold by
Digiovanni Gregory and Digiovanni Nicolle E
Bought by
Digiovanni Gregory and Digiovanni Nicolle E
Current Estimated Value
Purchase Details
Closed on
Apr 27, 2004
Sold by
Brunone Christopher J and Brunone Michelle
Bought by
Digiovanni Gregory and Lafrennie Nicole E
Purchase Details
Closed on
Aug 25, 1994
Sold by
Katona Frank and Katona Patricia
Bought by
Brunone Christopher and Brunone Michelle
Create a Home Valuation Report for This Property
The Home Valuation Report is an in-depth analysis detailing your home's value as well as a comparison with similar homes in the area
Home Values in the Area
Average Home Value in this Area
Purchase History
| Date | Buyer | Sale Price | Title Company |
|---|---|---|---|
| Digiovanni Gregory | -- | -- | |
| Digiovanni Gregory | $410,000 | -- | |
| Brunone Christopher | $194,000 | -- |
Source: Public Records
Mortgage History
| Date | Status | Borrower | Loan Amount |
|---|---|---|---|
| Open | Brunone Christopher | $311,200 | |
| Closed | Brunone Christopher | $304,000 |
Source: Public Records
Tax History
| Year | Tax Paid | Tax Assessment Tax Assessment Total Assessment is a certain percentage of the fair market value that is determined by local assessors to be the total taxable value of land and additions on the property. | Land | Improvement |
|---|---|---|---|---|
| 2025 | $10,731 | $292,040 | $128,100 | $163,940 |
| 2024 | $10,428 | $292,040 | $128,100 | $163,940 |
| 2023 | $10,261 | $292,040 | $128,100 | $163,940 |
| 2022 | $10,096 | $292,040 | $128,100 | $163,940 |
| 2021 | $6,003 | $241,640 | $0 | $0 |
| 2020 | $8,618 | $241,640 | $0 | $0 |
| 2018 | $7,961 | $228,340 | $106,750 | $121,590 |
| 2017 | $7,382 | $228,340 | $106,750 | $121,590 |
| 2016 | $7,613 | $228,340 | $106,750 | $121,590 |
| 2015 | $7,648 | $228,500 | $106,800 | $121,700 |
| 2014 | $7,486 | $228,500 | $106,800 | $121,700 |
Source: Public Records
Map
Nearby Homes
- 25 Plymouth Ave
- 45 Frenchtown Rd
- 65 Bonnie View Dr
- 26 Grove St
- 11 Linda Dr
- 114 Minturn Place
- 110 Minturn Rd
- 30 Windy Ridge
- 563 Lakeside Dr
- 3125 Old Town Rd
- 99 Quinsey Dr
- 394 Anton Dr
- 74 Village Ln
- 1403 Old Town Rd Unit 1403
- 546 Church Hill Rd
- 291 Frenchtown Rd
- 252 Bear Paw Rd
- lot 194 Prospect Ave
- 93 Oxford St Unit 95
- 114 Oxford St
Your Personal Tour Guide
Ask me questions while you tour the home.