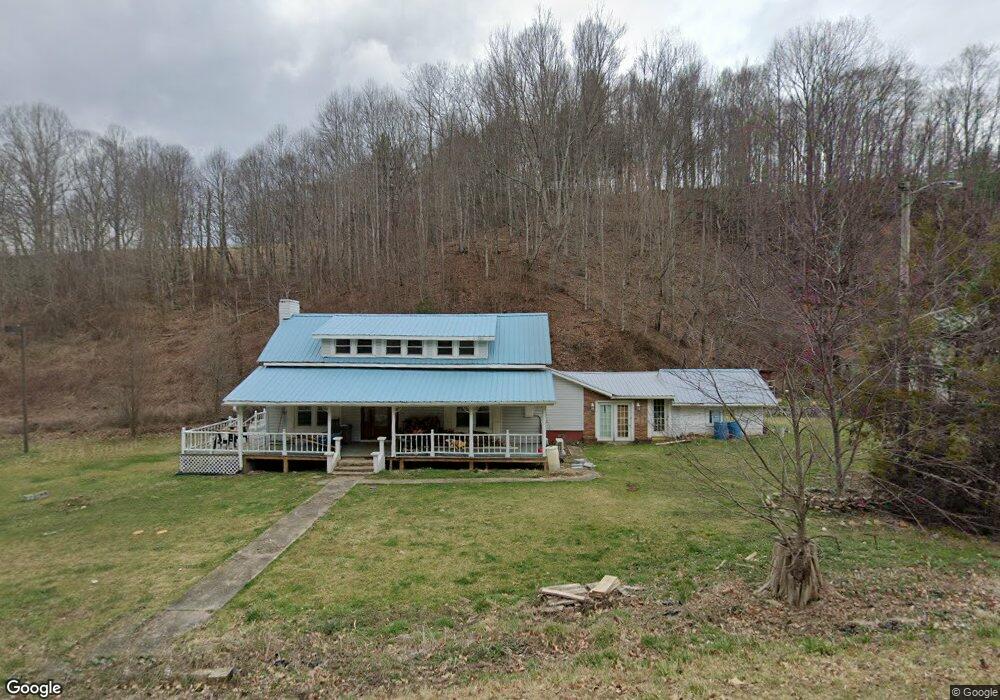
238 Highway 67 N Trade, TN 37691
Estimated Value: $112,000 - $258,000
--
Bed
1
Bath
1,572
Sq Ft
$115/Sq Ft
Est. Value
About This Home
This home is located at 238 Highway 67 N, Trade, TN 37691 and is currently estimated at $181,041, approximately $115 per square foot. 238 Highway 67 N is a home located in Johnson County with nearby schools including Johnson County Middle School and Johnson County High School.
Ownership History
Date
Name
Owned For
Owner Type
Purchase Details
Closed on
Sep 15, 2020
Sold by
Ward Steve and Ward Marie
Bought by
Norris Eric S
Current Estimated Value
Home Financials for this Owner
Home Financials are based on the most recent Mortgage that was taken out on this home.
Original Mortgage
$73,292
Outstanding Balance
$45,585
Interest Rate
2.9%
Mortgage Type
Construction
Estimated Equity
$135,456
Purchase Details
Closed on
Sep 24, 2015
Sold by
Reverse Mtg Solutions Inc
Bought by
Ward Steve and Ward Marie
Purchase Details
Closed on
Mar 16, 2015
Sold by
Mains Arlie
Bought by
Reverse Mtg Solutions Inc
Purchase Details
Closed on
Jan 11, 2012
Sold by
Mains Arlie and Mains Rosa
Bought by
Reverse Mortage Solutions Inc
Purchase Details
Closed on
Nov 14, 2011
Sold by
Main Arlie
Bought by
Garcia Jesus
Purchase Details
Closed on
Oct 16, 1965
Bought by
Main Arlie & Rosa
Create a Home Valuation Report for This Property
The Home Valuation Report is an in-depth analysis detailing your home's value as well as a comparison with similar homes in the area
Home Values in the Area
Average Home Value in this Area
Purchase History
| Date | Buyer | Sale Price | Title Company |
|---|---|---|---|
| Norris Eric S | $72,000 | None Available | |
| Ward Steve | $45,000 | -- | |
| Reverse Mtg Solutions Inc | $100,000 | -- | |
| Reverse Mortage Solutions Inc | -- | -- | |
| Garcia Jesus | $15,000 | -- | |
| Main Arlie & Rosa | -- | -- |
Source: Public Records
Mortgage History
| Date | Status | Borrower | Loan Amount |
|---|---|---|---|
| Open | Norris Eric S | $73,292 |
Source: Public Records
Tax History Compared to Growth
Tax History
| Year | Tax Paid | Tax Assessment Tax Assessment Total Assessment is a certain percentage of the fair market value that is determined by local assessors to be the total taxable value of land and additions on the property. | Land | Improvement |
|---|---|---|---|---|
| 2024 | $689 | $31,175 | $13,475 | $17,700 |
| 2023 | $689 | $31,175 | $13,475 | $17,700 |
| 2022 | $564 | $31,175 | $13,475 | $17,700 |
| 2021 | $564 | $31,175 | $13,475 | $17,700 |
| 2020 | $580 | $31,175 | $13,475 | $17,700 |
| 2019 | $580 | $28,275 | $13,475 | $14,800 |
| 2018 | $587 | $28,275 | $13,475 | $14,800 |
| 2017 | $587 | $28,650 | $13,475 | $15,175 |
| 2016 | $587 | $28,650 | $13,475 | $15,175 |
| 2015 | $519 | $28,650 | $13,475 | $15,175 |
| 2014 | $511 | $28,225 | $13,475 | $14,750 |
Source: Public Records
Map
Nearby Homes
- 1131 Cherry Springs Ln
- 10950 Highway 421 S
- TBD Modock Rd
- TBD N Us Hwy 421
- Tbd Modock Northeast Rd
- Tbd Miller Rd
- 222 June Apple Ln
- 184 Hobert Rd S
- 8180 Old Us Highway 421
- 10032 Highway 421 S
- 9980 Hwy 412 S
- TBD NE Moddock Rd
- Lots C24 & C33 Buffalo Nvno
- H406 Buffalo Nvno
- 404 Buffalo Nvno
- C34 Bow and Arrow Nvno
- TBD Buffalo Nvno
- 230 Sgt Pardue Cir
- 1929/1993 Bulldog Rd
- H103 Acorn Nvno
- 329 Highway 67 N
- 331 Highway 67 N
- 255 Highway 67 N
- 370 Highway 67 N
- TBD Drakes Creek Rd Rd
- 228 Highway 67 N
- 447 Highway 67 N
- 504 Highway 67 N
- 11281 Highway 421 S
- 11191 Highway 421 S
- 581 Highway 67 N
- 121 Highway 67 N
- 139 Modock Rd
- 1485 Drakes Creek Rd
- 215 Modock Rd
- 000 Buffalo Nvno None
- 9824 Hwy 412
- 11115 Highway 421 S
- 11136 Highway 421 S
- 11304 U S 421