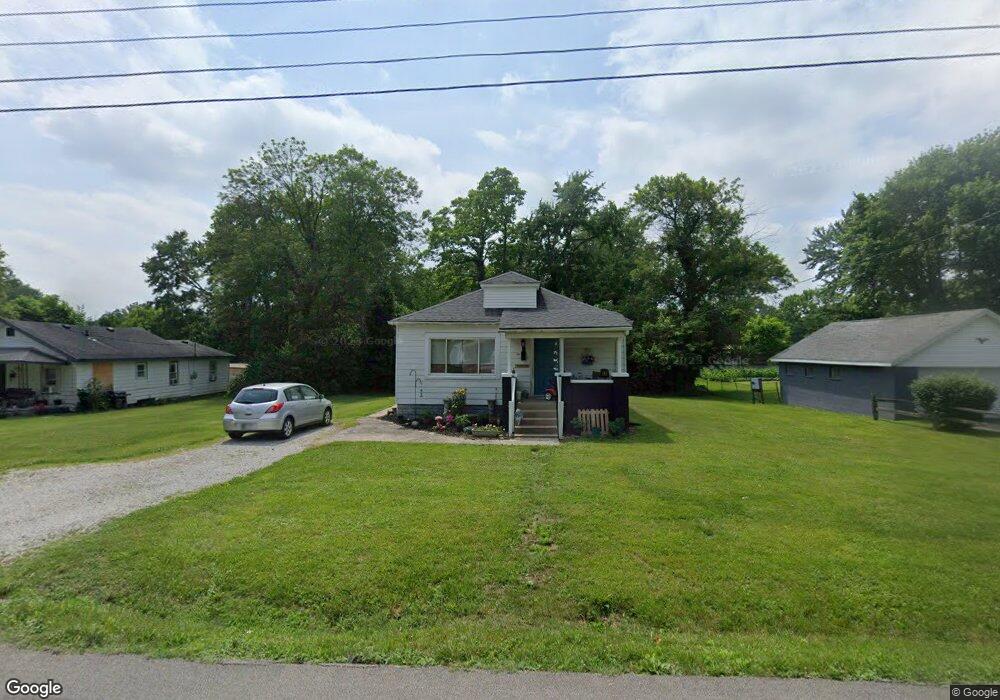
238 Mann Ave Austin, IN 47102
Estimated Value: $112,668 - $126,000
2
Beds
1
Bath
884
Sq Ft
$134/Sq Ft
Est. Value
About This Home
This home is located at 238 Mann Ave, Austin, IN 47102 and is currently estimated at $118,417, approximately $133 per square foot. 238 Mann Ave is a home located in Scott County with nearby schools including Austin Elementary School, Austin Middle School, and Austin High School.
Ownership History
Date
Name
Owned For
Owner Type
Purchase Details
Closed on
Dec 3, 2019
Sold by
Clemons Sean and Clemons Sean G
Bought by
Danner And Goodin Llc
Current Estimated Value
Home Financials for this Owner
Home Financials are based on the most recent Mortgage that was taken out on this home.
Original Mortgage
$150,000
Outstanding Balance
$70,565
Interest Rate
3.7%
Mortgage Type
Commercial
Estimated Equity
$47,852
Purchase Details
Closed on
Sep 12, 2019
Sold by
Stamper Kathy
Bought by
Clemons Sean
Purchase Details
Closed on
Dec 12, 2011
Sold by
Thormyer Albert and Estate Of Carl J Boedicker
Bought by
Stamper Ray Douglas
Purchase Details
Closed on
Jan 18, 2008
Sold by
Campbell Danny and Campbell Douglas
Bought by
Boedicker Carl J R
Purchase Details
Closed on
Sep 25, 2002
Sold by
Burris Earl C and Burris Betty
Bought by
Burris Earl C and Burris Betty
Create a Home Valuation Report for This Property
The Home Valuation Report is an in-depth analysis detailing your home's value as well as a comparison with similar homes in the area
Home Values in the Area
Average Home Value in this Area
Purchase History
| Date | Buyer | Sale Price | Title Company |
|---|---|---|---|
| Danner And Goodin Llc | -- | None Available | |
| Clemons Sean | -- | None Available | |
| Stamper Ray Douglas | -- | None Available | |
| Boedicker Carl J R | -- | None Available | |
| Burris Earl C | -- | -- |
Source: Public Records
Mortgage History
| Date | Status | Borrower | Loan Amount |
|---|---|---|---|
| Open | Danner And Goodin Llc | $150,000 |
Source: Public Records
Tax History Compared to Growth
Tax History
| Year | Tax Paid | Tax Assessment Tax Assessment Total Assessment is a certain percentage of the fair market value that is determined by local assessors to be the total taxable value of land and additions on the property. | Land | Improvement |
|---|---|---|---|---|
| 2024 | $1,116 | $45,500 | $9,500 | $36,000 |
| 2023 | $934 | $35,300 | $9,500 | $25,800 |
| 2022 | $790 | $35,800 | $9,500 | $26,300 |
| 2021 | $673 | $32,500 | $9,500 | $23,000 |
| 2020 | $714 | $35,700 | $9,500 | $26,200 |
| 2019 | $530 | $26,500 | $9,500 | $17,000 |
| 2018 | $740 | $27,500 | $9,500 | $18,000 |
| 2017 | $548 | $27,400 | $9,500 | $17,900 |
| 2016 | $864 | $26,500 | $9,500 | $17,000 |
| 2014 | $570 | $28,500 | $12,800 | $15,700 |
| 2013 | $570 | $30,800 | $12,800 | $18,000 |
Source: Public Records
Map
Nearby Homes