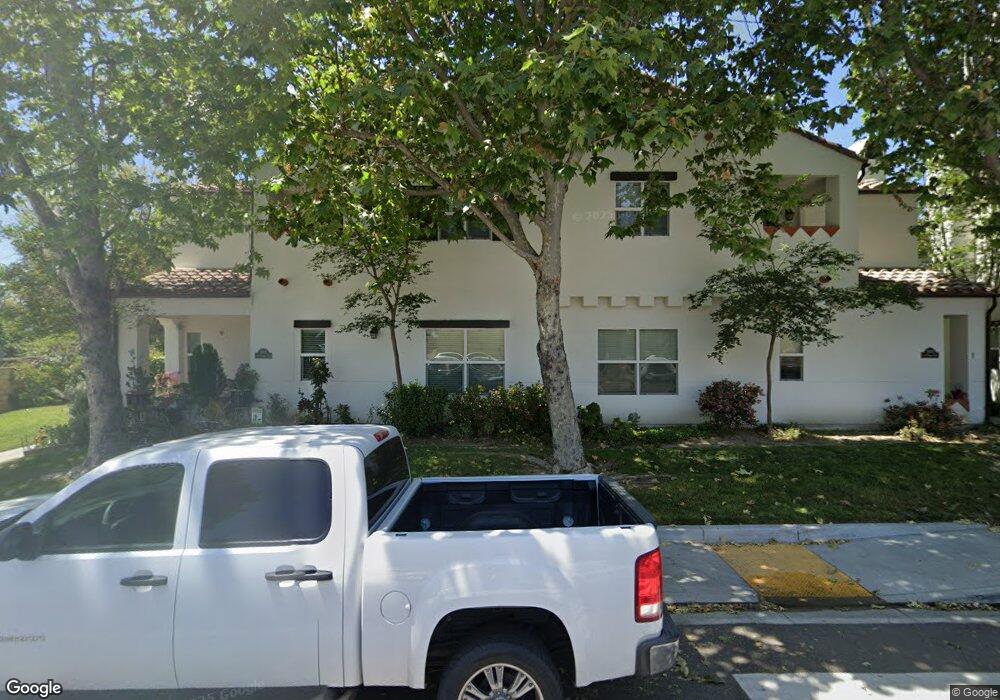
238 March St Unit 4 Santa Paula, CA 93060
Estimated Value: $385,000 - $590,000
2
Beds
2
Baths
952
Sq Ft
$474/Sq Ft
Est. Value
About This Home
This home is located at 238 March St Unit 4, Santa Paula, CA 93060 and is currently estimated at $451,512, approximately $474 per square foot. 238 March St Unit 4 is a home located in Ventura County with nearby schools including Glen City Elementary School, Isbell Middle, and Santa Paula High.
Ownership History
Date
Name
Owned For
Owner Type
Purchase Details
Closed on
Feb 11, 2025
Sold by
Cerda Alison M
Bought by
Alison M Cerda Trust and Cerda
Current Estimated Value
Purchase Details
Closed on
Nov 5, 2012
Sold by
Garcia Amelia
Bought by
Cerda Alison M
Home Financials for this Owner
Home Financials are based on the most recent Mortgage that was taken out on this home.
Original Mortgage
$163,975
Interest Rate
3.25%
Mortgage Type
FHA
Purchase Details
Closed on
Jul 12, 2008
Sold by
Garcia Nicolas and Garcia Amelia
Bought by
Garcia Amelia
Purchase Details
Closed on
Nov 22, 2006
Sold by
March Street Development Partners Inc
Bought by
Garcia Nicolas and Garcia Amelia
Home Financials for this Owner
Home Financials are based on the most recent Mortgage that was taken out on this home.
Original Mortgage
$374,000
Interest Rate
7.12%
Mortgage Type
New Conventional
Create a Home Valuation Report for This Property
The Home Valuation Report is an in-depth analysis detailing your home's value as well as a comparison with similar homes in the area
Home Values in the Area
Average Home Value in this Area
Purchase History
| Date | Buyer | Sale Price | Title Company |
|---|---|---|---|
| Alison M Cerda Trust | -- | None Listed On Document | |
| Cerda Alison M | $167,000 | Multiple | |
| Garcia Amelia | -- | None Available | |
| Garcia Nicolas | $374,000 | Lawyers Title Company 81 |
Source: Public Records
Mortgage History
| Date | Status | Borrower | Loan Amount |
|---|---|---|---|
| Previous Owner | Cerda Alison M | $163,975 | |
| Previous Owner | Garcia Nicolas | $374,000 |
Source: Public Records
Tax History Compared to Growth
Tax History
| Year | Tax Paid | Tax Assessment Tax Assessment Total Assessment is a certain percentage of the fair market value that is determined by local assessors to be the total taxable value of land and additions on the property. | Land | Improvement |
|---|---|---|---|---|
| 2025 | $2,308 | $205,637 | $102,820 | $102,817 |
| 2024 | $2,308 | $201,605 | $100,804 | $100,801 |
| 2023 | $2,259 | $197,652 | $98,827 | $98,825 |
| 2022 | $2,192 | $193,777 | $96,889 | $96,888 |
| 2021 | $2,185 | $189,978 | $94,989 | $94,989 |
| 2020 | $2,173 | $188,032 | $94,016 | $94,016 |
| 2019 | $2,055 | $184,346 | $92,173 | $92,173 |
| 2018 | $2,028 | $180,732 | $90,366 | $90,366 |
| 2017 | $2,050 | $177,190 | $88,595 | $88,595 |
| 2016 | $1,927 | $173,716 | $86,858 | $86,858 |
| 2015 | $1,841 | $171,108 | $85,554 | $85,554 |
| 2014 | $1,885 | $167,758 | $83,879 | $83,879 |
Source: Public Records
Map
Nearby Homes
- 324 W Santa Barbara St
- 362 W Santa Barbara St
- 352 Moultrie Place
- 525 W Santa Barbara St
- 1848 Jojoba Dr
- 413 Checkerbloom Ln
- 1856 Jojoba Dr
- 1865 Jojoba Dr
- 455 Snowdrop Ln
- 0 Dickenson Rd
- 102 E Ventura St Unit D
- 102 E Ventura St Unit A
- 107 Sonoma Ln
- 545 W Santa Paula St
- 605 Elfred Ct
- 33 Outer Dr Unit 33
- 423 Atmore Dr
- 428 Anacapa Terrace
- 342 Princeton St
- 100 E Virginia Terrace
- 238 March St
- 238 March St Unit 1
- 238 March St Unit 3
- 238 March St Unit 2
- 238 March St
- 242 March St Unit 2
- 242 March St Unit 1
- 242 March St Unit 3
- 242 March St Unit 4
- 236 March St Unit 2
- 236 March St Unit 4
- 236 March St Unit 3
- 236 March St Unit 1
- 102 Dean Dr Unit 4
- 102 Dean Dr Unit 3
- 102 Dean Dr Unit 1
- 102 Dean Dr Unit 2
- 246 March St Unit 2
- 246 March St Unit 1
- 246 March St Unit 3